Science

Genetic Algorithms, News, Science

News: Using genetic algorithms to optimise current and future health planning

From a publication of 28/10/2010, of the authors Saoshi Sasaki, Alexis J Comber, Hiroshi Suzuki and Chris Brunsdon:

Background

Ambulance response time is a crucial factor in patient survival. The number of emergency cases (EMS cases) requiring an ambulance is increasing due to changes in population demographics. This is decreasing ambulance response times to the emergency scene. This paper predicts EMS cases for 5-year intervals from 2020, to 2050 by correlating current EMS cases with demographic factors at the level of the census area and predicted population changes. It then applies a modified grouping genetic algorithm to compare current and future optimal locations and numbers of ambulances. Sets of potential locations were evaluated in terms of the (current and predicted) EMS case distances to those locations.

Results

Future EMS demands were predicted to increase by 2030 using the model (R2=0.71). The optimal locations of ambulances based on future EMS cases were compared with current locations and with optimal locations modelled on current EMS case data. Optimising the location of ambulance stations locations reduced the average response times by 57 seconds. Current and predicted future EMS demand at modelled locations were calculated and compared.

Conclusions

The reallocation of ambulances to optimal locations improved response times and could contribute to higher survival rates from life-threatening medical events. Modelling EMS case ‘demand’ over census areas allows the data to be correlated to population characteristics and optimal ‘supply’ locations to be identified. Comparing current and future optimal scenarios allows more nuanced planning decisions to be made. This is a generic methodology that could be used to provide evidence in support of public health planning and decision making.

Read the original paper here.

News, Pyevolve, Python, Science

Pyevolve on SIGEVOlution

SIGEVOlution200901WebCover

I’m proud to announce that Pyevolve is featuring on the last issue of SIGEVOlution (Volume 4, Issue 1), a newsletter from the ACM Special Interest Group on Evolutionary Computation. I would like to thank the newsletter editor Pier Luca Lanzi and the board for the corrections in the article and for the well done reformatted version of the paper.

Pyevolve is currently in version 0.5, in a few months I’ll be releasing the new 0.6 release with the new major features that are currently implemented in the development version only (you can check it at the subversion repository in sourceforge.net).

I hope you enjoy the article !

Yours,
– Christian S. Perone

Genetic Algorithms, News, Science

Meanwhile, at the Hall of Justice!

UPDATE 05/10: there is an article in the Physorg too.

Sometimes we face new applications for EC, but for this I was not expecting, from Eurekalert:

WASHINGTON, Oct. 5 — Criminals are having a harder time hiding their faces, thanks to new software that helps witnesses recreate and recognize suspects using principles borrowed from the fields of optics and genetics.

(…)

His software generates its own faces that progressively evolve to match the witness’ memories. The witness starts with a general description such as “I remember a young white male with dark hair.” Nine different computer-generated faces that roughly fit the description are generated, and the witness identifies the best and worst matches. The software uses the best fit as a template to automatically generate nine new faces with slightly tweaked features, based on what it learned from the rejected faces.

“Over a number of generations, the computer can learn what face you’re looking for,” says Solomon.

Read the full article here.

News, Science

On the irreversibility of evolution

evo_comic

Today I’ve read about an important work done by a team of evolutionary biologists of the University of Oregon, which reveals an important result about the evolutionary irreversibility. The concept of irreversibility states that the future results of evolution at any point in time must depend on the present state and by the past, showing the determinism of evolution; on the other hand, the evolution reversibility dictates that the natural selection can produce the same forms in any given environment, independent of history.

This question about the irreversibility of evolution has remained unsolved because of the fact that we rarely know what features the ancestors had and what the mechanisms was used to evolve into the actual organisms, but the team of Joe Thornton has solved those issues by studying the problem at the molecular level, resurrecting ancestral proteins (GR1) as they existed long ago and using manipulation to study evolutionary process in two directions: forward and reverse.

The results of the work done by the research team was:

Our observations suggest that history and contingency during glucocorticoid receptor evolution strongly limited the pathways that could be deterministically followed under selection.

(…)

Selection is an extraordinarily powerful evolutionary force; nevertheless, our observations suggest that, because of the complexity of glucocorticoid receptor architecture, low-probability permissive substitutions were required to open some mutational trajectories to exploration under selection, whereas restrictive substitutions closed other potential paths. Under selection, some kind of adaptation will always occur, but the specific adaptive forms that are realized depend on the historical trajectory that precedes them. The conditions that once facilitated evolution of the glucocorticoid receptor’s ancestors were destroyed during the realization of its present form. The past is difficult to recover because it was built on the foundation of its own history, one irrevocably different from that of the present and its many possible futures.

So my friend, that’s the way nature evolve, possible never looking back. But this is a great new step for future works and research on the irreversibility of evolution.

References

[1] http://www.nature.com/nature/journal/v461/n7263/abs/nature08249.html
[2] http://www.uoregon.edu/~joet/PDF/bridgham-thornton-nature2009.pdf
[3] http://sciencenow.sciencemag.org/cgi/content/full/2009/923/1

News, Python, Science

An analysis of Benford’s law applied to Twitter

Benford’s law is one of those very weird things that we can’t explain, and when we discover more and more phenomena that obey the law, we became astonished. Two people (Simon Newcomb – 1881 and Frank Benford – 1938) noted the law in the same way, while flipping pages of a logarithmic table book; they noticed that the pages at the beginning of the book were dirtier than the pages at the end.

Currently, there are no a priori criteria that say to us when a dataset will or will not obey the Benford’s Law. And it is because of this, that I’ve done an analysis on the Twitter Public Timeline.

The Twitter API to get Public Timeline is simply useless for this analysis because in the API Docs, they say that the Public Timeline is cached for 60 seconds ! 60 seconds is an eternity, and there is a request rating of 150 request/hour. So, it doesn’t help, buuuuuut, there is an alpha testing API with pretty and very useful streams of data from the Public Timeline; there are many methods in the Twitter Streaming API, and the most interesting one is the “Firehose”, which returns ALL the public statuses, but this method is only available for intere$ting people, and I’m not one of them. Buuuut, we have “Spritzer”, which returns a portion of all public statuses, since it’s only what we have available in the moment, it MUST be useful, and it’s a pretty stream of data =)

So, I’ve got the Spritzer real-time stream of data and processed each new status which arrived with a regex to find all the numbers in the status; if the status was “I have 5 dogs and 3 cats”, the numbers collected should be “[5, 3]”. All those accumulated numbers were then checked against the Benford’s Law. I’ve used Matplotlib to plot the two curves (the Benford’s Law and the Twitter statuses digits distribution) to empirically observe the correlation between them. You can note in the upper right corner of the video, the Pearson’s correlation between the two distributions too.

Here is the video (I’ve seen only after creating of the video, but the color of  the curves are the inverse as seen in the legend):

The video represents the 15 minutes (3.160 captured statuses) of the Twitter Public Timeline. At the end of the video, you can see a Pearson’s correlation of 0.95. It seems that we have found another Benford’s son =)

The little tool to handle the Twitter Spritzer stream of data and plot the correlation graph in real-time was entirely written in Python, I’ll do a clean-up and post it here soon I got time. The tool has generated 1823 png images that were merged using ffmpeg.

I hope you enjoyed =)

Cite this article as: Christian S. Perone, "An analysis of Benford’s law applied to Twitter," in Terra Incognita, 11/08/2009, https://blog.christianperone.com/2009/08/an-analysis-of-benfords-law-applied-to-twitter/.

UPDATE 11/08: the user “poobare” has cited an interesting paper about Benford’s Law on Reddit, here is the link.

More posts about Benford’s Law

Prime Numbers and the Benford’s Law

Delicious.com, checking user numbers against Benford’s Law

Benford’s Law meets Python and Apple Stock Prices

News, Python, Science

Prime Numbers and the Benford’s Law

Today, I read a news article from the Physorg.com about the new pattern found in the Prime Numbers, the article talks about the new discovery by Bartolo Luque and Lucas Lacasa:

In a recent study, Bartolo Luque and Lucas Lacasa of the Universidad Politécnica de Madrid in Spain have discovered a new pattern in primes that has surprisingly gone unnoticed until now. They found that the distribution of the leading digit in the prime number sequence can be described by a generalization of Benford’s law.

I was very surprised by the fact that nobody have noticed that before and after read the original paper (if you are interested, read it) describing the new patterns discovered, I was very impressed and impatient to see it in pratice !

The new pattern discovered is based on the so-called GBL (Generalized Benford’s Law), which you can see in the paper at the Eq 3.1:

gbl

Where the P(d) means the probability of appearance of the leading digit d. The alpha is the exponent of the original power law distribution (for alpha = 1, the GBL reduces to the Benford’s law).

The authors says that for a given integer interval of [1,N], there exists a particular value alpha(N) for which the GBL fits with extremely good accuracy the first digit distribution of the primes appearing in that interval and showing the functional relation between alpha and N in the Eq 3.2:

functional

Where a = 1.10 +- 0.05 for large values of N. They also cite a GBL extension, but I’ll use just these formulae to plot our distributions.

So I have implemented these formulae into the simple pybenford module as follows:

def gbl(alpha, digit):
   return 1/(10**(1-alpha)-1)*((digit + 1)**(1-alpha)-digit**(1-alpha))

def calc_alpha(n, a=1.10):
   return 1/(math.log(n)-a)

def gbenford_law(alpha):
   return [gbl(alpha, digit)*100.0 for digit in xrange(1,10)]

For the reason that we are using an infinite integer sequence, we must always pick the sequence interval [1, N] where N = 10^D  (see the  Natural Density section of the paper for more information).

The next step is to create a list of prime numbers between an arbitrary interval of D=8, or [1,10^8]. In this step I used the Sieve (see more information) utility to create a file with the generated prime numbers in the cited interval, I used the follow command to get this file output:

sieve2310.exe -s 1 -e 100000000  >>sieve_n8.txt

The sieve is very fast, this will create the file “sieve_n8.txt” with nearly 66MB (don’t worry, it’s a very fast generation, it took 8 seconds for me using a Intel Core 2 Duo 2GHz).

And we are ready to use Python and pybenford to read the prime numbers, calculate the leading digits frequency and plot our result ! Here is the code I created:

import pybenford

sieve_file = open("sieve_n8.txt", "r")
prime_list = [int(prime) for prime in sieve_file]
sieve_file.close()

alpha              = pybenford.calc_alpha(10**8)
benford_law        = pybenford.gbenford_law(alpha)
prime_distribution = pybenford.calc_firstdigit(prime_list)
pybenford.plot_comparative(prime_distribution, benford_law, "Prime Numbers")

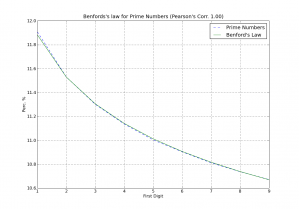
And voilà, here is the output plot showing an extremely good accuracy claimed by paper authors (click on the image to enlarge):

prime_plot

The plotting of the distributions (click to enlarge)

If you are interested on Benford’s law, there are some posts about it here and here.

I hope you liked this =)

UPDATE 10/05: Mike Loukides did a good work generalizing for other bases, thank you for sharing your experiment Mike.

UPDATE 08/08 (lol): There are many more comments about this post on Reddit, see here.