Uncategorized

Uncategorized

[pt-br] Dados das enchentes no Rio Grande do Sul (RS) em 2024

É muito triste ver as enchentes devastadoras que tem atingido o Rio Grande do Sul nos últimos anos. Decidi fazer este post pra tentar compreender melhor a escala e o impacto desses eventos usando algumas fotos de satélite e dados recentes sobre as enchentes. Maioria das imagens recentes são do MODIS (Moderate Resolution Imaging Spectroradiometer) do qual fiz um post em 2009 (artigo aqui) que usam 2 satélites (Terra e Aqua) para fazer cobertura quase diária em baixa resolução da terra inteira.

Estamos no meio de uma tragédia sem precedentes, por outro lado, este é um momento único para a coleta de dados por parte de pesquisadores e governo com a esperança de melhorar a modelagem desses processos hidrológicos para desenvolver sistemas de alerta e previsão de enchentes. Nunca antes observamos estes processos complexos nos rios do Rio Grande do Sul, este momento é extremamente importante para o futuro do RS.

PS: tentarei manter atualizado este post com novas imagens.

Avisos de licença das imagens:

Sentinel images: contains modified Copernicus Sentinel data 2024 processed by Sentinel Hub.
MODIS (Aqua/Terra): NASA/OB.DAAC.

Uncategorized

Arduino WAN, Helium network and cryptographic co-processor

I was recently interested in the intersection of Machine Learning and RF and I was taking a look into LoRa modulation, which is based on Chirp Spread Spectrum (CSS), and ended up getting to know more about the Helium network. I still think that the most stupid piece of technology behind crypto mining is spending GPU/CPU/ASIC cycles to do proof-of-work (PoW), but in the Helium network, they did something quite interesting, which was to switch to something useful such as the proof-of-coverage instead of generating heat and burning energy. Therefore we can say that the miners are doing something useful by providing radio coverage, instead of purely generating heat.

(more…)

Uncategorized

Talk: Gradient-based optimization for Deep Learning

This weekend I gave a talk at the Machine Learning Porto Alegre Meetup about optimization methods for Deep Learning. In this material you will find an overview of first-order methods, second-order methods and some approximations of second-order methods as well about the natural gradient descent and approximations to it. I took some long nights to prepare this material, so I hope you like it! You can download the PDF of the slides by clicking on the top-right menu.

– Christian S. Perone

Uncategorized

Visualizing sample simplex trajectories in Deep Learning

Softmax is a distribution over choices, it maps a vector into the probability simplex that is defined as \Delta_{n-1}=\{p\in\mathbb{R}^n\; \vert\; 1^\top p = 1 \; \; {\rm and} \;\; p \geq 0 \}, where the sum of all elements of the vector must equal 1. Softmax is used a lot in classification and I thought it would be interesting to visualize (when possible, on lower dimensions) the trajectories of individual samples in that simplex as predicted by the network while the network is being trained.

In the animations below you’ll see the trajectories of the sample individual sample (from the test set) over the simplex of 3 classes (dog, cat, horse) from CIFAR-10 and using a simple shallow CNN both with Adam and SGD. Each frame is generated after 10 optimization steps and the video is from 4 epochs with CIFAR-10 dataset with only the 3 aforementioned classes.

Trajectory of a CNN using Adam with LR of 0.001

Trajectory of a CNN using SGD with LR of 0.001 and momentum

Uncategorized

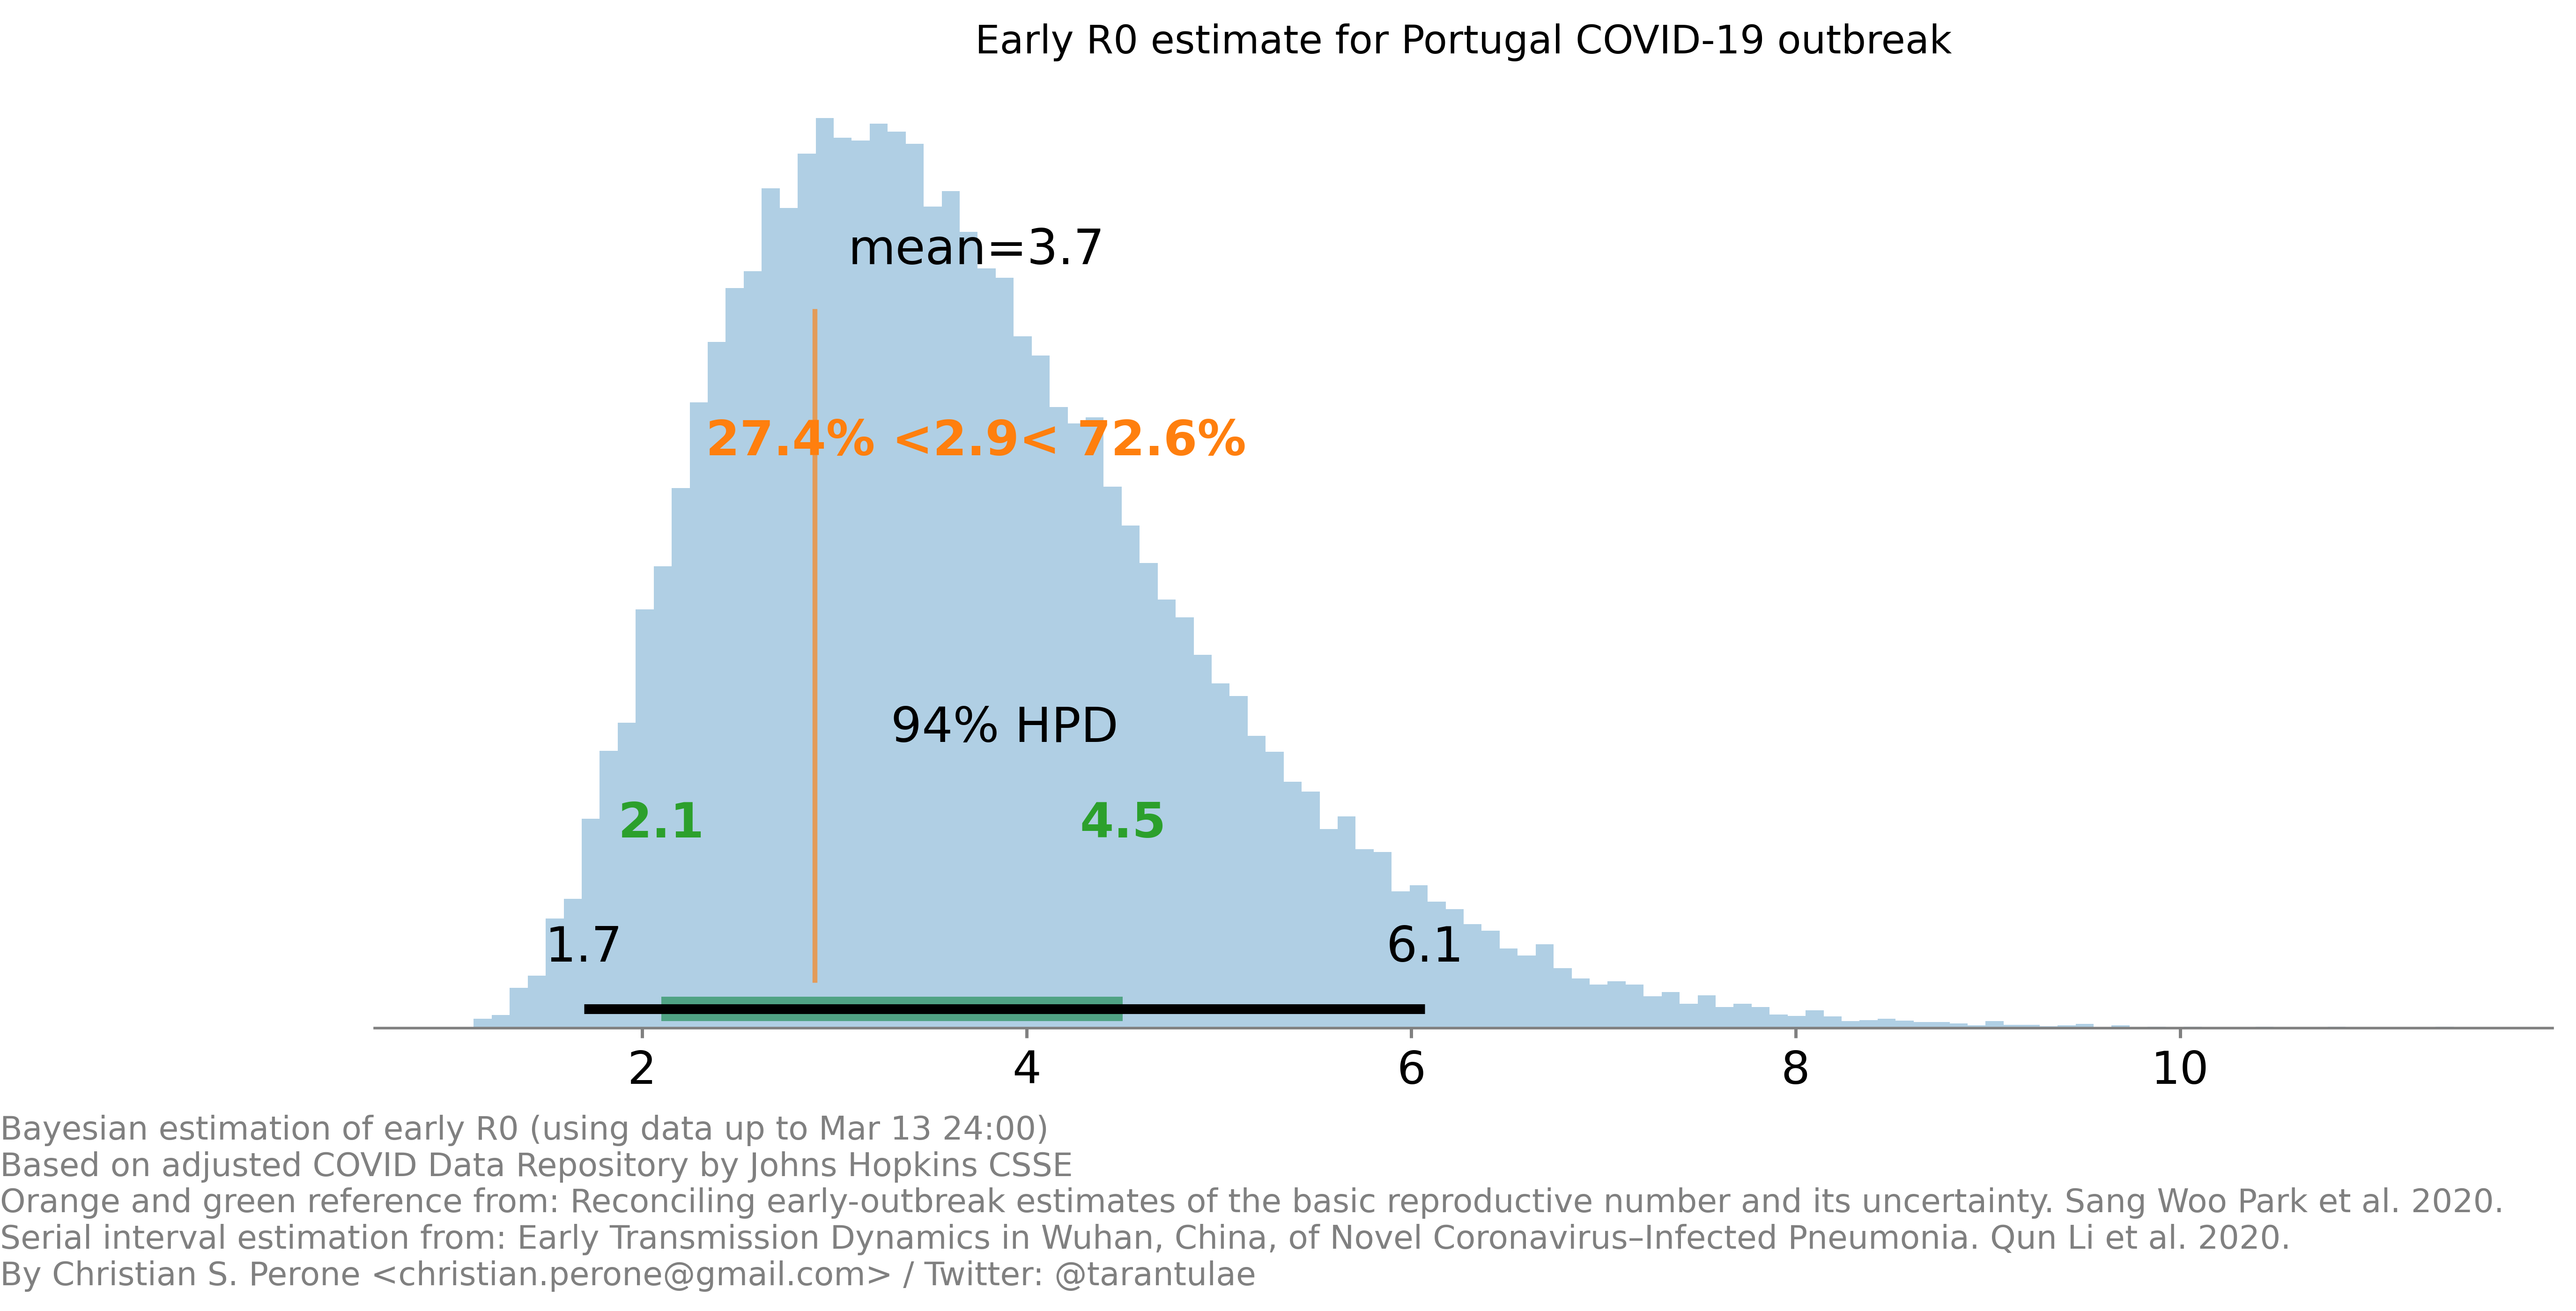
First early R0 estimate for Portugal COVID-19 outbreak

Just posting the first early estimate for the COVID-19 R_0 (basic reproduction number) in Portugal outbreak. Details on the image, more information to come soon. This estimate is taking into consideration the uncertainty for the generation interval and the growth.

Cite this article as: Christian S. Perone, "First early R0 estimate for Portugal COVID-19 outbreak," in Terra Incognita, 14/03/2020, https://blog.christianperone.com/2020/03/first-early-r0-estimate-for-portugal-covid-19-outbreak/.

Uncategorized

Visualizing network ensembles with bootstrap and randomized priors

A few months ago I made a post about Randomized Prior Functions for Deep Reinforcement Learning, where I showed how to implement the training procedure in PyTorch and how to extract the model uncertainty from them.

Using the same code showed earlier, these animations below show the training of an ensemble of 40 models with 2-layer MLP and 20 hidden units in different settings. These visualizations are really nice to understand what are the convergence differences when using or not bootstrap or randomized priors.

Naive Ensemble

This is a training session without bootstrapping data or adding a randomized prior, it’s just a naive ensembling:

Ensemble with Randomized Prior

This is the ensemble but with the addition of the randomized prior (MLP with the same architecture, with random weights and fixed):

$$Q_{\theta_k}(x) = f_{\theta_k}(x) + p_k(x)$$

The final model \(Q_{\theta_k}(x)\) will be the k model of the ensemble that will fit the function \(f_{\theta_k}(x)\) with an untrained prior \(p_k(x)\):

Ensemble with Randomized Prior and Bootstrap

This is a ensemble with the randomized prior functions and data bootstrap:

Ensemble with a fixed prior and bootstrapping

This is an ensemble with a fixed prior (Sin) and bootstrapping:

Cite this article as: Christian S. Perone, "Visualizing network ensembles with bootstrap and randomized priors," in Terra Incognita, 20/07/2019, https://blog.christianperone.com/2019/07/visualizing-network-ensembles-with-bootstrap-and-randomized-priors/.