I would like to share the video of the Eric Floehr (from ForecastWatch / Intellovations) presentation at PyCon 2011:
The aim of this post is to show to the reader how to plot the recent Japan earthquake data from the USGS using the pyearthquake module. If you want to know more information about the pyearthquake module, take a look in this post where I previously used it. pyearthquake is a pure-python module which exposes an API to retrieve data from the USGS site as well from the MODIS Rapid Response System (recently, they created a separate project to handle Japan daily images).
Installing pyearthquake
The first thing we need to do is to install the Python pyearthquake module, you can do it using easy_install from setuptools:
easy_install pyearthquake
The easy_install should automatically handle the required modules, but if you face problems (specially in Ubuntu with basemap, here is the version requirements: matplotlib >= 0.99.0, numpy >= 1.3.0, PIL >= 1.1.6 and basemap >= 0.99.4.
Retrieving USGS catalogs
USGS provides the follow catalog datasets:
M1+ Earthquakes (past hour) – M1+PAST_HOUR
This is the worldwide catalog with earthquake data from the past hour;
M1+ Earthquakes (past day) – M1+PAST_DAY
This is the worldwide catalog with earthquake data from the past day;
M1+ Earthquakes (past 7 days) – M1+PAST_7DAY
This is the worldwide catalog with earthquake data from the past 7 days;
This is how you retrieve any of these catalogs using pyearthquake:
>>> from pyearthquake import *
>>> catalog = usgs.retrieve_catalog("M1+PAST_7DAY")
>>> len(catalog)
1179
In that context, we have 1179 incidents with magnitude 1+ from the past 7 days.
Lets filter now only events with magnitude 6+, which represents the recent significant earthquakes:
>>> mag6_list = [event for event in catalog if float(event["Magnitude"]) >= 6.0]
>>> len(mag6_list)
30
We have now 30 events with magnitude 6+ from the past 7 days, let’s print it:
>>> for row in mag6_list:
...    print row["Eqid"], row["Magnitude"], row["Depth"],
...          row["Datetime"], row["Depth"], row["Region"]
...
c0001z5z 6.3 8.70 Friday, March 11, 2011 20:11:22 UTC 8.70 near the east coast of Honshu, Japan
c0001z4n 6.6 10.00 Friday, March 11, 2011 19:46:49 UTC 10.00 near the west coast of Honshu, Japan
c0001z2t 6.1 24.80 Friday, March 11, 2011 19:02:58 UTC 24.80 near the east coast of Honshu, Japan
c0001z2a 6.2 10.00 Friday, March 11, 2011 18:59:15 UTC 10.00 near the west coast of Honshu, Japan
c0001yib 6.2 18.90 Friday, March 11, 2011 15:13:14 UTC 18.90 near the east coast of Honshu, Japan
c0001y4u 6.5 11.60 Friday, March 11, 2011 11:36:39 UTC 11.60 near the east coast of Honshu, Japan
(...)
As you can see, almost all last events are earthquakes from the Japan coast. Here, you can extract any individual event and retrieve USGS products like ShakeMaps, etc (see more information in this post on how to fetch and show those USGS products).
Plotting events into the map
Now we will plot those events into the map (pyearthquake uses the matplotlib toolkit called basemap to plot events into the map):
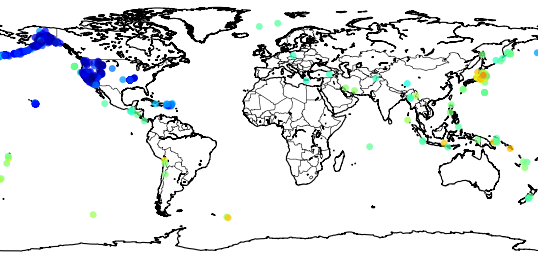
>>> usgs.plot_events(catalog)
The “catalog” variable is the same we retrieved before using the USGS M1+PAST_7DAY catalog.
Here is what what this statement will show:
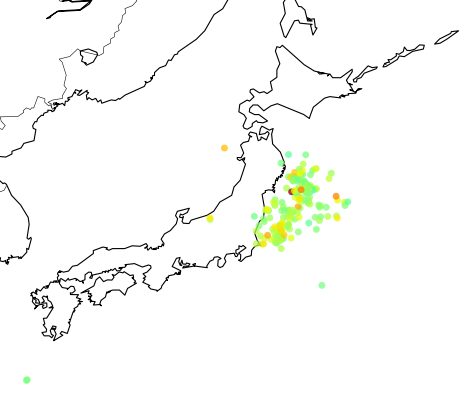
Now we can zoom into Japan using the button ![]() , and this is the result:
, and this is the result:
 The colored dots are the events from the retrieved catalog, the more strong the color the more strong was the earthquake; see the dark red color near the cost, that event was the unfortunate and catastrophic 8.9 magnitude earthquake which devastated Japan yesterday.
Retrieving near real-time MODIS Rapid Response images
MODIS has processed image subsets of Aqua and Terra satellites. One of these subsets is called “japan” and it has the entire country coverage. Let’s retrieve this MODIS subset and then plot our events in this same map:
>>> import datetime
>>> now = datetime.datetime.now()
>>> bmap = modis.get_modis_subset(now,
                              "Japan",
                              satellite_name="terra",
                              resolution="250m",
                              show=False)
>>> usgs.plot_events(catalog, bmap)
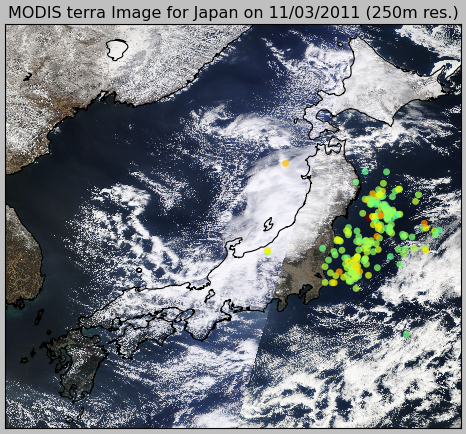
What pyearthquake is going to do here is to download (this may take some time) the entire subset for the resolution of 250m (the best available), parse the subset metadata, align image into the map between the lat/lng bounds and then plot the events over this satellite image, so we’ll have the last high resolution satellite images from the Japan together with the earthquake events plot, and here is the result:
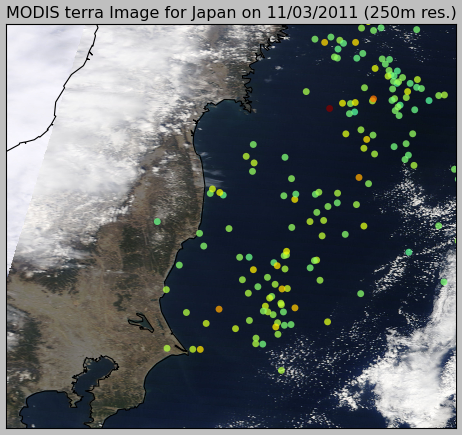
And here is the zoom near the coast:
If you are going to PyCon US 2011, I would like to invite you to the talk “Genetic Programming in Python“, the talk will be given by Eric Floehr on March 12th 1:20 p.m. – 2:05 p.m.
Here is the abstract:
Did you know you can create and evolve programs that find solutions to problems? This talk walks through how to use Genetic Algorithms and Genetic Programming as tools to discover solutions to hard problems, when to use GA/GP, setting up the GA/GP environment, and interpreting the results. Using pyevolve, we’ll walk through a real-world implementation creating a GP that predicts the weather.
(…)
Genetic Algorithms (GA) and Genetic Programming (GP) are methods used to search for and optimize solutions in large solution spaces. GA/GP use concepts borrowed from natural evolution, such as mutation, cross-over, selection, population, and fitness to generate solutions to problems. If done well, these solutions will become better as the GA/GP runs.
GA/GP has been used in problem domains as diverse as scheduling, database index optimization, circuit board layout, mirror and lens design, game strategies, and robotic walking and swimming. They can also be a lot of fun, and have been used to evolve aesthetically pleasing artwork, melodies, and approximating pictures or paintings using polygons.
GA/GP is fun to play with because often-times an unexpected solution will be created that will give new insight or knowledge. It might also present a novel solution to a problem, one that a human may never generate. Solutions may also be inscrutable, and determining why a solution works is interesting in itself.


