Year: 2009

Genetic Algorithms, News, Pyevolve, Time Waste

Travelling Salesman on Sony PSP using Stackless Python + Pyevolve

This is my first PoC of the Travelling Salesman Problem on PSP, since I’ve installed the Pyevolve on the Sony PSP,  I can optimize any problem while using the graphical interface of PSP (in that problem I’m using the 2D functions to plot the cities and the path) to show results in real-time. Here is the video, the quality is very low, I’ve used my cellphone 🙂

Here is the source code I’ve used, the Pyevolve version of this example is the development version r166, which in the future will be the 0.6 final release (I’m working on many new features yet, so it will take time to release), however, this PoC should work on 0.5 release too:

import psp2d, pspos

WHITE_COLOR = psp2d.Color(255,255,255)
CLEAR_COLOR = psp2d.Color(0,0,0,255)
RED_COLOR   = psp2d.Color(255, 0, 0)

cm     = []
coords = []
CITIES = 20

pspos.setclocks(333,166)
psp_scr  = psp2d.Screen()
psp_font = psp2d.Font('font.png')
psp_scr.clear(CLEAR_COLOR)
psp_font.drawText(psp_scr, 0, 5, "Loading Pyevolve modules...")
psp_scr.swap()

from pyevolve import G1DList
from pyevolve import GSimpleGA
from pyevolve import GAllele
from pyevolve import Mutators
from pyevolve import Crossovers
from pyevolve import Consts

from random import shuffle as rand_shuffle, randint as rand_randint
from math import sqrt

def cartesian_matrix(coords):
   """ A distance matrix """
   matrix={}
   for i,(x1,y1) in enumerate(coords):
      for j,(x2,y2) in enumerate(coords):
         dx, dy = x1-x2, y1-y2
         dist=sqrt(dx*dx + dy*dy)
         matrix[i,j] = dist
   return matrix

def tour_length(matrix, tour):
   """ Returns the total length of the tour """
   total = 0
   for i in range(CITIES):
      j      = (i+1)%CITIES
      total += matrix[tour[i], tour[j]]
   return total

def write_tour_to_img(coords, tour):
   """ The function to plot the graph """
   psp_scr.clear(CLEAR_COLOR)
   for i in range(CITIES):
      j      = (i+1)%CITIES
      city_i = tour[i]
      city_j = tour[j]
      x1, y1 = coords[city_i]
      x2, y2 = coords[city_j]
      psp_scr.drawLine(int(x1), int(y1), int(x2), int(y2), WHITE_COLOR)
      psp_font.drawText(psp_scr, int(x1)+7, int(y1)-5, str(i))
      psp_scr.fillRect(int(x1), int(y1), 6, 6, RED_COLOR)

   psp_scr.swap()

def G1DListTSPInitializator(genome, **args):
   """ The initializator for the TSP """
   lst = [i for i in xrange(genome.getListSize())]
   rand_shuffle(lst)
   genome.genomeList = lst

def evolve_callback(ga_engine):
   """ Callback called every generation by Pyevolve """
   write_tour_to_img(coords, ga_engine.bestIndividual())
   return False

def main_run():
   global cm, coords

   width, height = psp_scr.size
   coords = [(rand_randint(0, width),rand_randint(0, height))
                 for i in xrange(CITIES)]
   cm     = cartesian_matrix(coords)

   setOfAlleles = GAllele.GAlleles(homogeneous=True)
   range_allele = GAllele.GAlleleRange(0, len(coords)-1)
   setOfAlleles.add(range_allele)

   genome = G1DList.G1DList(len(coords))
   genome.setParams(allele=setOfAlleles)

   genome.evaluator.set(lambda chromosome: tour_length(cm, chromosome))
   genome.mutator.set(Mutators.G1DListMutatorSwap)
   genome.crossover.set(Crossovers.G1DListCrossoverOX)
   genome.initializator.set(G1DListTSPInitializator)

   ga = GSimpleGA.GSimpleGA(genome)
   ga.setMinimax(Consts.minimaxType["minimize"])
   ga.setGenerations(300)
   ga.setPopulationSize(200)
   ga.setCrossoverRate(1.0)
   ga.setMutationRate(0.1)
   ga.stepCallback.set(evolve_callback)

   ga.evolve()

if __name__ == "__main__":
   main_run()
Genetic Algorithms, genetic programming, News, Science

Google Search Insight for GA and GP

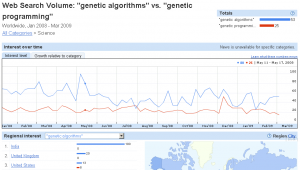
I have done a search for the keywords “genetic algorithm” and “genetic programming” on Google Insights for Search and I noticed that India is the region with the most interest on this search terms:

insight

I’ve used the category “Science” to remove some terms of other search categories, but unfortunately this is only an approximation of the real interest, since is obviously that the terms “genetic algorithms” can be searches of algorithms for genetics too.

Genetic Algorithms, Pyevolve, Python

Rosenbrock’s banana function and friends

This post is a report of an optimization test suite applied to Pyevolve GA Core.

I’m writing a paper about Pyevolve and I’ve done some tests on the GA quality of Pyevolve with must common optimization test functions: Schaffer, Rastringin, Sphere, Ackley and the absolute GA-hard Rosenbrock. Follows in the end of the post, the results of the trials, I’ve exported the latex formulae as images.

The only function that the GA had some trouble (it failed to find the global minima in 3 of 10 trials, the “fail” term means that it had not found an optimal solution for 5.000 generations) was the Rosenbrock’s function with 20 variables, also known as Rosenbrock’s banana function due the dinstinctive shape of the contour lines, here is the 3D plot with 2 variables.

As Wikipedia says,

This function is often used to test performance of optimization algorithms. The global minimum is inside a long, narrow, parabolic shaped flat valley. To find the valley is trivial, however to converge to the global minimum is difficult.

However, this behavior was not unexpected, since we can note the same on the research of [1], [2], [3] and [4], among other many papers.

I think this trial results brings more reliability to the framework, when the Pyevolve paper was published, I’ll post it here.

[1] Seredynski, Franciszek, et. al. (2003). “Function Optimization with Coevolutionary Algorithms”, in International Intelligent Information Processing and Web Mining Conference.

[2] Hiroyasu, Tomoyuki, et. al. (1999). “Distributed Genetic Algorithms with Randomized Migration Rate”, IEEE Proceedings of Systems, Man and Cybernetics Conference SMC’99, Vol. 1, pp. 689-694.

[3] Bouvry, Pascal, et. al. (1997). “Distributed evolutionary optimization in Manifold: the Rosenbrock’s function case study”, Duke University.

[4] Panait, Liviu (2002). “A comparison of two competitive fitness functions”, in GECCO 2002: Proceedings of the Genetic and Evolutionary Computation Conference.

Article, Genetic Algorithms, News, Philosophy, Science

Considerations regarding Karl Popper’s philosophy of science and Evolutionary Algorithms

There is a portuguese version of this post here.

I am a big fan of the Karl Popper’s philosophy of science, so I decided to write something about what I find interesting in his philosophy, especially in relation to rational criticism, to talk later a little bit of what I think about this in relation to Evolutionary Algorithms (EAs).

karlpopper

Popper, in his book “In Search of a Better World” (the original title is “Auf der Suche nach einer besseren Welt“), cites the importance of rational criticism in science and combat the dogmatism of belief in the scientific authority. For me, this idea, despite intrinsic in the thoughts of many philosophers, was not so clearly exposed as Popper did, the clarity with how Popper gives us the insight about how the science grows and improves through rational criticism is remarkable, and I’ll try to summarize here what he tried to explain for almost whole life.

(more…)

Genetic Algorithms, Pyevolve, Python

Pyevolve on Sony PSP ! (genetic algorithms on PSP)

Sony PSP can be more interesting than funny sometimes. Few people know about the potential of the PSP port of Stackless Python 2.5.2. This great port of python was done by Carlos E. and you can find more information about the progress of the port on his blog.

Well, I’ve tested the Pyevolve GA framework on the Stackless Python for PSP and for my surprise, it worked without changing one single line of code on the framework due the fact of Pyevolve has been written in pure Python (except the platform specific issue like the Interactive Mode, but this issue is automaticly disabled on unsupported platforms).

So now, we have Genetic Algorithms on PSP.

Follow some screenshots (click to enlarge):

psp2psp1

The GA running on the PSP screenshot is the minimization of the Sphere function.

Here is the steps to install Pyevolve on PSP:

PSP Stackless Python Installation

1) First, create a directory called “python” on your PSP under the “/PSP/GAME” and the directory structure “/python/site-packages/” on the root of your memory stick (this last directory will be used to put Pyevolve later).
2) Copy the EBOOT.PBP and the python.zip files to this created directory;

Pyevolve Installation

3) Download the Pyevolve source and copy the directory called “pyevolve” to the created directory “/python/site-packages/”, the final directory structure will be: “/python/site-packages/pyevolve”

Ready ! Now you can import Pyevolve modules inside scripts on your PSP, of course you can’t use the graphical plotting tool or some DB Adapters of Pyevolve, but the GA Core it’s working very well.

Here is some basic usage of PSP Stackless Python port. I’ve used the psp2d module to show the information on screen. When I got more time, I’ll port the visualization of the TSP problem to use the psp2d, it will be nice to see Traveling Salesperson Problem running with real-time visualization on PSP =)

Related Links

Google Code Project of PSP Stackless Python

Genetic Algorithms, Pyevolve, Python

Pyevolve: the effect of Linear Scaling

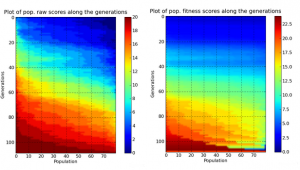
There’s an interesting graph in Pyevolve which is a heat-like graph of the population raw and fitness scores. In this graph you can note the effect of Linear Scaling over the scores, the raw scores graph is in left and the fitness scaled scores is in the right, this plot uses the Gaussian interpolation method.

linear

This graph feature is very interesting to study the effects of selections and scaling schemes and even to see the propagation of best individuals on the population while evolving, I think this graph should be more explored.

News, Python, Time Waste

Python: 3D real-time debugging and function call structure

Here is two videos of a small script (python and xmlrpc calls to ubigraph visualization server) created to show a 3D graph of  the function call structure of a python application, the first shows only the structure created while running the application and the next video shows a debugging-like tool, it changes the node color to red when the function is called, and the labels shows: function name, python file name and the line on the python file where the code is.

Update (26/02): download here the script source-code.

To use the script, start the Ubigraph visualization server and add the profile module to your python application, it will looks like this:

import prof3d

def run_main():
   # your code

if __name__ == "__main__":
   prof3d.profile_me()
   run_main()

News, Python, Time Waste

Twitter in 3D !

I was doing some tests on the Ubigraph dynamic graph visualization tool and I have this idea to use the Ubigraph tool to render 3D graphs of Twitter friends on real-time. Follows the video of the scripting utility I’ve created, it starts with a red node of your twitter and when you click, it shows your friends, when you click on your friends, it shows their  friends, and so on. I think it is interesting those social network graphs, when I got more time I’ll put more ideas on the pratice =)

Update (26/02): download here the script source-code.
To use it, you must install python-twitter, use the easy_install:

easy_install python-twitter

I’ve tested with Python 2.5, but it should works on 2.4 and 2.6 too.

Start the Ubigraph visualization server and run the script. The syntax for the script is like this:

python twitter3d.py -u username

You can get a help using:

python twitter3d.py –help