Year: 2009

Genetic Algorithms, News, Science

Evolving autopilots could boost space slingshots

From the NewScientist article:

COULD space probes use genetic algorithms as autopilots to help them navigate the complexities of the solar system?

Deep-space missions such as NASA’s veteran z Voyager probes often rely on gravity assists. They use a planet’s gravitational field as a slingshot, which allows them to visit other celestial bodies without using up too much fuel. But programming a probe with its trajectory years ahead of time can be a problem, says Ian Carnelli of the European Space Agency in Noordwijk, the Netherlands.

Missed launch windows, unexpected winds and misbehaving rockets mean that probes hardly ever leave Earth in the planned position or velocity, and radiation pressure from solar flares can perturb the craft’s course in deep space. If the probe is out of position when it starts a gravity-assisted manoeuvre, the slingshot will be inefficient.

In the Journal of Guidance, Control and Dynamics (DOI: 10.2514/1.32633), Carnelli and colleagues Bernd Dachwald and Massimiliano Vasile suggest that a probe could navigate for itself using a genetic algorithm (GA).

(…)

Carnelli likens this to hundreds of virtual pilots flying simulated spacecraft, with the GA disposing of those that waste fuel or steer a slow course, while “breeding” the best ones together, a process akin to natural selection. “After hundreds of generations of the GA you obtain a ‘pilot’ that is an extremely good performer – able to fly the assist trajectory that uses the least propellant while reaching the next target planet faster,” he says. Carnelli has run successful simulations of GA-enabled missions to Mercury via Venus, and Pluto via Jupiter.

(…)

Read the full article.

News, Science

‘Evolutionary Algorithms’ Mimic Natural Evolution In Silico And Lead To Innovative Solutions For Complex Problems

An interesting news article was recently published by Science Daily, it talks mainly about the use of Evolutionary Algorithms to solve some complex problems like resource management in low rainfall regions, building bricks and automotive electronics:

Extensive resource management is required in low rainfall regions, where groundwater reserves are rare and must be tapped with great care. Various factors must be taken into account: How the ground water interacts with its environment, where drilling must be performed without disadvantaging neighbours, how the ground water can be protected over a long period of time, and how the development costs can be kept as low as possible: This complex application problem was examined by Tobias Siegfried and Wolfgang Kinzelbach, professor at the Institute for Environmental Engineering at the ETH Zurich, with the help of simulated evolution (…)

090502091200-large

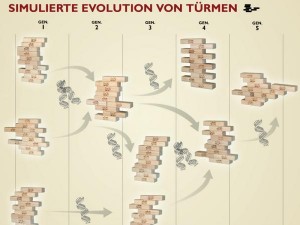
Perfected tower construction with the help of Evolutionary Algorithms.
(Credit: Johannes Bader /ETH Zürich)

Read the full article.

Python, Time Waste

Delicious.com, checking user numbers against Benford’s Law

Sometimes, Benford’s Law is used to check some datasets and detect fraud. If a dataset which is supposed to follow the Benford’s Law distribution diverges from the law, we can say that the dataset is a possible fraud (caution with assumptions, and please, note the word “possible” here).

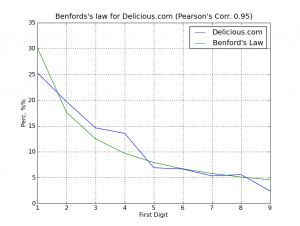
So I had an idea to check the number of users of the Delicious.com website, which is supposed to follow the Benford’s Law. I processed the tag “programming” and I got 40 pages of links with 376 user numbers from links of the Delicious.com. So, here is the plot:

delicious_plot

As we can see on the graph, the correlation was 0.95 (between -1 and 1), so we can say (really !!), Delicious.com is not lying about the user numbers on the links =) does anyone knows some suspect sites ?

Follow the source-code of the Python program, it uses a simple regex to get the user numbers from the pages:

import pybenford
import re
import urllib
import time

PAGES         = 40
DELICIOUS_URL = "http://delicious.com/tag/programming?page=%d"

reg         = re.compile('(\d+)', re.DOTALL |  re.IGNORECASE)
users_set = []

for i in xrange(1, PAGES+1):
   print "Reading the page %02d of %02d..." % (i, PAGES),
   site_handle = urllib.urlopen(DELICIOUS_URL % i)
   site_data   = site_handle.read()
   site_handle.close()
   map_to_int = map(int, reg.findall(site_data))
   print "%02d records!" % len(map_to_int)
   users_set.extend(map_to_int)
   time.sleep(5) # Be nice with servers !

print "Total records: %d" % len(users_set)

benford_law   = pybenford.benford_law()
digits_scale = pybenford.calc_firstdigit(users_set)
pybenford.plot_comparative(digits_scale, benford_law, "Delicious.com")
Python, Time Waste

Benford’s Law meets Python and Apple Stock Prices

UPDATE: See the post “Delicious.com, checking user numbers against Benford’s Law” if you want to see an one more example.

UPDATE 2: Brandon Gray has done a nice related work in Clojure, here is the link to the blog.

As Wikipedia says:

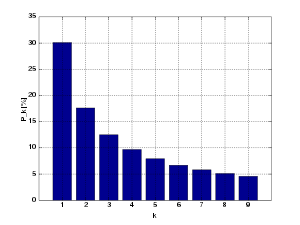
Benford’s law, also called the first-digit law, states that in lists of numbers from many real-life sources of data, the leading digit is distributed in a specific, non-uniform way. According to this law, the first digit is 1 almost one third of the time, and larger digits occur as the leading digit with lower and lower frequency, to the point where 9 as a first digit occurs less than one time in twenty. The basis for this “law” is that the values of real-world measurements are often distributed logarithmically, thus the logarithm of this set of measurements is generally distributed uniformly.

Which means that in a dataset (not all, of course) from a real-life source of data, like for example, the Death Rates, the first digit of every number in this dataset have “1” almost one third of time, “2” in 17.6% of times, and so on in a logarithmic scale. The Benford’s law distribution formulae is:

p(n) = \log_{10}\left( 1 +\frac{1}{n} \right)

Where the “n” is the leading digit.

This formulae makes the follow distribution plot (from Wikipedia image):

So I’ve made a Python module, called “pybenford”, which helps me in the creation and analysis of datasets, like the Stock Historical Prices for Apple Inc.

I think that the code is simple enough to understand and reuse:

import pybenford
import csv

def convert_value(value):
   return float(value.replace(",","."))

stock_file      = open("apple_stock.csv", "r")
csv_apple_stock = csv.reader(stock_file, delimiter=";")
yahoo_format    = csv_apple_stock.next()
stock_prices    = [ convert_value(row[yahoo_format.index("Volume")]) for row in csv_apple_stock ]

benford_law   = pybenford.benford_law()
benford_apple = pybenford.calc_firstdigit(stock_prices)

pybenford.plot_comparative(benford_apple, benford_law, "Apple Stock Volume")

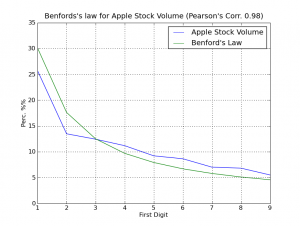
This code will iterate over the Apple Inc. historical data downloaded from Yahoo! Finance and will verify the leading digit for the field “Volume” of the dataset, the dataset is from between 1984 and today (200). Then the pybenford will plot (using Matplotlib) a comparative graph of the dataset with the Benford’s Law distribution. In the graph, there is a Pearson’s Correlation value on the title; the Pearson’s Correlation ranges from +1 to -1. A correlation of +1 means that there is a perfect positive linear relationship between variables.

Follow the plot of comparative (click on the image to enlarge):

stock_volume

As you can surprisely see, we have a strong correlation between the Volume data and the Benford’s Law, the Pearson’s Correlation was 0.98, a higher coefficient, this is like black magic for me =)

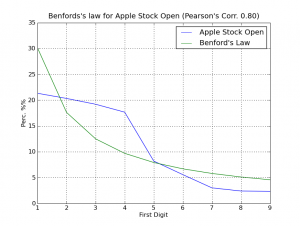
Follow another graph of the opening stock prices:

stock_open

The correlation this time was low, but it continues with a significant Pearson’s coefficient of 0.80.

I hope you enjoyed =)

The source-code for the “pybenford” can be downloaded here. This module is a simple collection of some very very simple functions.

Genetic Algorithms, News, Science

Digital Archeology Reveals Dinosaur Details using Genetic Algorithms

From the article of LiveScience.com:

The pick and shovel can go only so far in digging up details about dinosaurs. Now supercomputers are revealing knowledge about their anatomy otherwise lost to history.

(…)

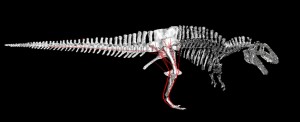
For example, if the muscles connected to the thigh bone of a Tyrannosaurus rex were short, that would suggest it was angled vertically as in humans. However, if they were very long, it could have been angled horizontally as in birds.

dino

Initial attempts to randomly decipher which pattern of muscle activation works best result almost always in the animal falling on its face, explained computer paleontologist Peter Falkingham at the University of Manchester. But the scientists employ “genetic algorithms,” or computer programs that can alter themselves and evolve, and so run pattern after pattern until they get improvements.

Eventually, they evolve a pattern of muscle activation with a stable gait and the dinosaur can walk, run, chase or graze, Falkingham said. Assuming natural selection evolves the best possible solution as well, the modeled animal should move similar to its now extinct counterpart. Indeed, they have achieved similar top speeds and gaits with computer versions of humans, emus and ostriches as in reality.

Read the full article.