Benford’s Law meets Python and Apple Stock Prices
UPDATE: See the post “Delicious.com, checking user numbers against Benford’s Law” if you want to see an one more example.
UPDATE 2: Brandon Gray has done a nice related work in Clojure, here is the link to the blog.
As Wikipedia says:
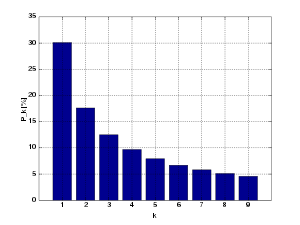
Benford’s law, also called the first-digit law, states that in lists of numbers from many real-life sources of data, the leading digit is distributed in a specific, non-uniform way. According to this law, the first digit is 1 almost one third of the time, and larger digits occur as the leading digit with lower and lower frequency, to the point where 9 as a first digit occurs less than one time in twenty. The basis for this “law” is that the values of real-world measurements are often distributed logarithmically, thus the logarithm of this set of measurements is generally distributed uniformly.
Which means that in a dataset (not all, of course) from a real-life source of data, like for example, the Death Rates, the first digit of every number in this dataset have “1” almost one third of time, “2” in 17.6% of times, and so on in a logarithmic scale. The Benford’s law distribution formulae is:
Where the “n” is the leading digit.
This formulae makes the follow distribution plot (from Wikipedia image):

So I’ve made a Python module, called “pybenford”, which helps me in the creation and analysis of datasets, like the Stock Historical Prices for Apple Inc.
I think that the code is simple enough to understand and reuse:
import pybenford
import csv

def convert_value(value):
   return float(value.replace(",","."))

stock_file      = open("apple_stock.csv", "r")
csv_apple_stock = csv.reader(stock_file, delimiter=";")
yahoo_format    = csv_apple_stock.next()
stock_prices    = [ convert_value(row[yahoo_format.index("Volume")]) for row in csv_apple_stock ]

benford_law   = pybenford.benford_law()
benford_apple = pybenford.calc_firstdigit(stock_prices)

pybenford.plot_comparative(benford_apple, benford_law, "Apple Stock Volume")
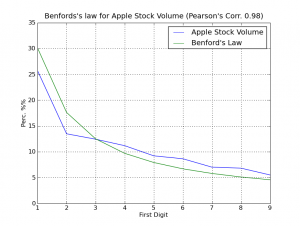
This code will iterate over the Apple Inc. historical data downloaded from Yahoo! Finance and will verify the leading digit for the field “Volume” of the dataset, the dataset is from between 1984 and today (200). Then the pybenford will plot (using Matplotlib) a comparative graph of the dataset with the Benford’s Law distribution. In the graph, there is a Pearson’s Correlation value on the title; the Pearson’s Correlation ranges from +1 to -1. A correlation of +1 means that there is a perfect positive linear relationship between variables.
Follow the plot of comparative (click on the image to enlarge):
As you can surprisely see, we have a strong correlation between the Volume data and the Benford’s Law, the Pearson’s Correlation was 0.98, a higher coefficient, this is like black magic for me =)
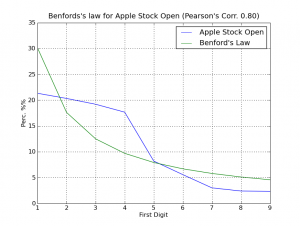
Follow another graph of the opening stock prices:
The correlation this time was low, but it continues with a significant Pearson’s coefficient of 0.80.
I hope you enjoyed =)
The source-code for the “pybenford” can be downloaded here. This module is a simple collection of some very very simple functions.


Nice bit o’ code
I think the first example was great in terms of choice and result.
The second not so much as the prices are related to one another and that breaks one of the premises of Benfords law. (i think)
Still nice code, though.
Thank you for your comment artied !
Christian, this is a great post! I referenced it in a Benford/Clojure article I wrote last week. You may enjoy. http://ossenabled.com/2009/05/benfords-law-meets-clojure/
delimter is “,”
Very cool piece of code. Thank you.