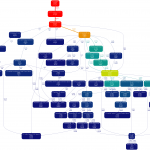
Here is two videos of a small script (python and xmlrpc calls to ubigraph visualization server) created to show a 3D graph of the function call structure of a python application, the first shows only the structure created while running the application and the next video shows a debugging-like tool, it changes the node color to red when the function is called, and the labels shows: function name, python file name and the line on the python file where the code is.
Update (26/02): download here the script source-code.
To use the script, start the Ubigraph visualization server and add the profile module to your python application, it will looks like this:
import prof3d

def run_main():
   # your code

if __name__ == "__main__":
   prof3d.profile_me()
   run_main()


