Time Waste

Python, Time Waste

Google Analytics Visualization

Sometime ago I discovered the project called Gource, which is a Software Version Control Visualization tool created by Andrew Caudwell. Gource has a very interesting visualization structure which isn’t exclusive to Version Control systems, but also for a large variety of data; actually, you can create your own custom log (see CustomLogFormat wiki for more details) in order to use Gource visualization for your own data.

So I have created a Python script which exports the data from your Google Analytics profile and then convert it to the custom Gource log format. To extract Google Analytics data I used the Google Data API bindings for Python, you also can make your own Google Data API query (see some samples here).

My query to Google Data was:

'ids': 'ga:[profile id]',
'start-date': '2011-01-19',
'end-date': '2011-02-02',
'dimensions': 'ga:pagePath,ga:date,ga:hour,ga:country',
'metrics': 'ga:visits',
'sort': 'ga:date,ga:hour',
'filters': 'ga:pagePath!@outbound;ga:pagePath!@translate;ga:pagePath!@search',
'max-results': '500'

See that I used some filters to avoid outbound links, Google Translate links from users as well the Search option. The profile I’ve used in this example is the Pyevolve Documentation site which has two main directories (a site with more directories should provide you better visualization, since Gource is specially good on viewing branches on Version Control Systems), I also have limited the size of the results to 500, so we can get a short video.

Instead of using unique users to represent users, I’ve used countries and I also changed the default user icon from Gource to world flags (by Vathanx, you can download them here).

And here is the result (see in HD – 720p):


You can download the source code here. See the comments inside the script to use with your Google Analytics Profile. In order to get flags working, you need to extract the flags to a directory and then run “gource custom_log.txt –user-image-dir [directory-with-the-pngs]“.

I hope you enjoy it =)

– Christian S. Perone

Python, Time Waste

Beautiful Django

The ugly web is over; the trick is to add a Django middleware to process every HttpResponse (with content-type text/html) of Django using BeautifulSoup. The source-code of the middleware is simple:

from BeautifulSoup import BeautifulSoup

class BeautifulMiddleware(object):
    def process_response(self, request, response):
        if response.status_code == 200:
            if response["content-type"].startswith("text/html"):
                beauty = BeautifulSoup(response.content)
                response.content = beauty.prettify()
        return response

We simple check for HTTP response code 200 and then check for a “text/html” content and use BeautifulSoup to process the response. See an example of what it does:

1) I’d a html in my Django application, very ugly and with missing tags:

imagem

This HTML template will be rendered as showed above by Django without the BeautifulSoup middleware, but with the middleware pluged in the settings of your Django app, it will render that html source:

imagem2

BeautifulSoup has figured out sensible places to put the closing tags of the HTML source and has created a pretty indented structure, automagically =)

It’s very easy and interesting create new django middlewares, examples can be JavaScript obfuscators, compressors, automatic performance analysis of html code to improve the render speed of browser and these sort of things.

Python, Time Waste

Word is smart, but OpenOffice is wise

UPDATE 19/09: it seems that some people had misunderstood the post title, so here is a clarification: I’m not comparing Word with OpenOffice or something like that, the title refers to the design choices of OpenOffice in using Python 2.6 as an option for scripting language, it’s a humorous title and should not be considered in literal sense.

This is a very simple, but powerful, Python script to call Google Sets API (in fact it’s not an API call – since Google doesn’t have an official API for Sets service – but an interesting and well done scraper using BeautifulSoup) inside the OpenOffice 3.1.1 Writer… anyway, you can check the video to understand what it really does:

And here is the very complex source-code:

from xgoogle.googlesets import GoogleSets

def growMyLines():
   """ Calls Google Set unofficial API (xgoogle) """
   doc = XSCRIPTCONTEXT.getDocument()
   controller = doc.getCurrentController()
   selection = controller.getSelection()
   count = selection.getCount();
   text_range = selection.getByIndex(0);
   lines_list = text_range.getString().split("\n");
   gset = GoogleSets(lines_list)
   gset_results = gset.get_results()
   results_concat = "\n".join(gset_results)
   text_range.setString(results_concat);

g_exportedScripts = growMyLines,

You need to put the “xgoogle” module inside the “OpenOffice.org 3\Basis\program\python-core-2.6.1\lib” path, and the above script inside “OpenOffice.org 3\Basis\share\Scripts\python”.

I hope you enjoyed =) with new Python 2.6 core in OpenOffice 3, they have increased the productivity potential at the limit.

genetic programming, News, Pyevolve, Python, Time Waste

Approximating Pi number using Genetic Programming

pi

As many (or very few in the real life haha) people know, today is the Pi Approximation Day ! So it’s time to make a contribution to celebrate this funny day =)

My contribution is to use Python and Pyevolve to approximate Pi number using Genetic Programming approach. I’ve created the functions gp_add(+), gp_sub(-), gp_div(/), gp_mul(*) and gp_sqrt (square root) to use as non-terminals of the GP. The fitness function is very simple too, it simple returns the absolute difference between the Python math.pi and the evaluated individual. I’ve used also a population size of 1k individuals with max tree depth of 8 and the random ephemeral constants as random integers. The best approximation I’ve got while running the GP for about 8 minutes (40 generations) was 3.1416185511, best for 3 digits, you can improve it and let it run for more time to get better approximations.

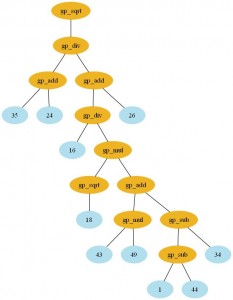
Here is the formulae I’ve got with the GP (click to enlarge):

tree_pi

And here is the output of the script:

Best (0): 3.1577998365
        Error: 0.0162071829
Best (10): 3.1417973679
        Error: 0.0002047143
Best (20): 3.1417973679
        Error: 0.0002047143
Best (30): 3.1417973679
        Error: 0.0002047143
Best (40): 3.1416185511
        Error: 0.0000258975

- GenomeBase
        Score:                   0.000026
        Fitness:                 15751.020831

        Params:          {'max_depth': 8, 'method': 'ramped'}

        Slot [Evaluator] (Count: 1)
        Slot [Initializator] (Count: 1)
                Name: GTreeGPInitializator - Weight: 0.50
                Doc: This initializator accepts the follow parameters:

   *max_depth*
      The max depth of the tree

   *method*
      The method, accepts "grow" or "full"

   .. versionadded:: 0.6
      The *GTreeGPInitializator* function.

        Slot [Mutator] (Count: 1)
                Name: GTreeGPMutatorSubtree - Weight: 0.50
                Doc:  The mutator of GTreeGP, Subtree Mutator

   .. versionadded:: 0.6
      The *GTreeGPMutatorSubtree* function

        Slot [Crossover] (Count: 1)
                Name: GTreeGPCrossoverSinglePoint - Weight: 0.50

- GTree
        Height:                 8
        Nodes:                  21

GTreeNodeBase [Childs=1] - [gp_sqrt]
  GTreeNodeBase [Childs=2] - [gp_div]
    GTreeNodeBase [Childs=2] - [gp_add]
      GTreeNodeBase [Childs=0] - [26]
      GTreeNodeBase [Childs=2] - [gp_div]
        GTreeNodeBase [Childs=2] - [gp_mul]
          GTreeNodeBase [Childs=2] - [gp_add]
            GTreeNodeBase [Childs=2] - [gp_sub]
              GTreeNodeBase [Childs=0] - [34]
              GTreeNodeBase [Childs=2] - [gp_sub]
                GTreeNodeBase [Childs=0] - [44]
                GTreeNodeBase [Childs=0] - [1]
            GTreeNodeBase [Childs=2] - [gp_mul]
              GTreeNodeBase [Childs=0] - [49]
              GTreeNodeBase [Childs=0] - [43]
          GTreeNodeBase [Childs=1] - [gp_sqrt]
            GTreeNodeBase [Childs=0] - [18]
        GTreeNodeBase [Childs=0] - [16]
    GTreeNodeBase [Childs=2] - [gp_add]
      GTreeNodeBase [Childs=0] - [24]
      GTreeNodeBase [Childs=0] - [35]

- GTreeGP
        Expression: gp_sqrt(gp_div(gp_add(26,
gp_div(gp_mul(gp_add(gp_sub(34,
gp_sub(44, 1)), gp_mul(49, 43)), gp_sqrt(18)),
16)), gp_add(24, 35)))

And finally, here is the source code:

from __future__ import division
from pyevolve import *
import math

def gp_add(a, b): return a+b
def gp_sub(a, b): return a-b
def gp_div(a, b): return 1 if b==0 else a/b
def gp_mul(a, b): return a*b
def gp_sqrt(a):   return math.sqrt(abs(a))

def eval_func(chromosome):
   code_comp = chromosome.getCompiledCode()
   ret = eval(code_comp)
   return abs(math.pi - ret)

def step_callback(engine):
   gen = engine.getCurrentGeneration()
   if gen % 10 == 0:
      best = engine.bestIndividual()
      best_pi = eval(best.getCompiledCode())
      print "Best (%d): %.10f" % (gen, best_pi)
      print "\tError: %.10f" % (abs(math.pi - best_pi))

   return False

def main_run():
   genome = GTree.GTreeGP()

   genome.setParams(max_depth=8, method="ramped")
   genome.evaluator += eval_func

   ga = GSimpleGA.GSimpleGA(genome)
   ga.setParams(gp_terminals       = ['ephemeral:random.randint(1, 50)'],
                gp_function_prefix = "gp")

   ga.setMinimax(Consts.minimaxType["minimize"])
   ga.setGenerations(50000)
   ga.setCrossoverRate(1.0)
   ga.setMutationRate(0.09)
   ga.setPopulationSize(1000)
   ga.stepCallback.set(step_callback)

   ga.evolve()
   best = ga.bestIndividual()
   best.writeDotImage("tree_pi.png")

   print best

if __name__ == "__main__":
   main_run()

If you are interested why today is the Pi Approximation day, see some resources:

Little Cartoon

Some Background History

Some Pi Approximations

Genetic Algorithms, Time Waste

The Darwin’s cake experiment

Suppose that you are the owner of a famous bakery, and you have a recipe of a really delicious cake which is well known and desired by many of your clients. Is in this scene that enters the Darwin’s cake experiment.

Suppose that you also have nearly 1.000 clients (you are very famous hehe) that you can send new cakes done by you with different amounts of ingredients and these same clients will return to you how much they liked the new cake recipe in a rating between 1 and 10 in a way to know what is the most popular desired taste.

So I was thinking, this is an optimization problem. Your problem is to find the almost “perfect” amouts of each ingredient of the cake for you most popular clients taste. If we use a Genetic Algorithm to solve this optimization problem, we can imagine some like this:

Create, let’s say, 1.000 cakes (the individuals) with random amounts of ingredients and send them to clients evaluation (fitness function), and then take the rating returned by your clients (the fitness). So you can now create a new generation of cake recipes by applying the genetic operators on the the first generation based on the clients ratings and so on.

This is just a joke, but if a big company decides to make it real, I think it’ll be very funny and they will create the first computer-generated cake !

I was thinking too, if things like this can be done to chemical products; you can do experiments in an automated way, this is a very interesting research field for robotics and AI =)

Python, Time Waste

Delicious.com, checking user numbers against Benford’s Law

Sometimes, Benford’s Law is used to check some datasets and detect fraud. If a dataset which is supposed to follow the Benford’s Law distribution diverges from the law, we can say that the dataset is a possible fraud (caution with assumptions, and please, note the word “possible” here).

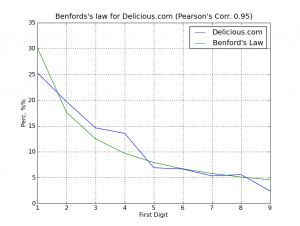
So I had an idea to check the number of users of the Delicious.com website, which is supposed to follow the Benford’s Law. I processed the tag “programming” and I got 40 pages of links with 376 user numbers from links of the Delicious.com. So, here is the plot:

delicious_plot

As we can see on the graph, the correlation was 0.95 (between -1 and 1), so we can say (really !!), Delicious.com is not lying about the user numbers on the links =) does anyone knows some suspect sites ?

Follow the source-code of the Python program, it uses a simple regex to get the user numbers from the pages:

import pybenford
import re
import urllib
import time

PAGES         = 40
DELICIOUS_URL = "http://delicious.com/tag/programming?page=%d"

reg         = re.compile('(\d+)', re.DOTALL |  re.IGNORECASE)
users_set = []

for i in xrange(1, PAGES+1):
   print "Reading the page %02d of %02d..." % (i, PAGES),
   site_handle = urllib.urlopen(DELICIOUS_URL % i)
   site_data   = site_handle.read()
   site_handle.close()
   map_to_int = map(int, reg.findall(site_data))
   print "%02d records!" % len(map_to_int)
   users_set.extend(map_to_int)
   time.sleep(5) # Be nice with servers !

print "Total records: %d" % len(users_set)

benford_law   = pybenford.benford_law()
digits_scale = pybenford.calc_firstdigit(users_set)
pybenford.plot_comparative(digits_scale, benford_law, "Delicious.com")
Python, Time Waste

Benford’s Law meets Python and Apple Stock Prices

UPDATE: See the post “Delicious.com, checking user numbers against Benford’s Law” if you want to see an one more example.

UPDATE 2: Brandon Gray has done a nice related work in Clojure, here is the link to the blog.

As Wikipedia says:

Benford’s law, also called the first-digit law, states that in lists of numbers from many real-life sources of data, the leading digit is distributed in a specific, non-uniform way. According to this law, the first digit is 1 almost one third of the time, and larger digits occur as the leading digit with lower and lower frequency, to the point where 9 as a first digit occurs less than one time in twenty. The basis for this “law” is that the values of real-world measurements are often distributed logarithmically, thus the logarithm of this set of measurements is generally distributed uniformly.

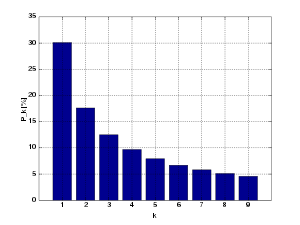
Which means that in a dataset (not all, of course) from a real-life source of data, like for example, the Death Rates, the first digit of every number in this dataset have “1” almost one third of time, “2” in 17.6% of times, and so on in a logarithmic scale. The Benford’s law distribution formulae is:

p(n) = \log_{10}\left( 1 +\frac{1}{n} \right)

Where the “n” is the leading digit.

This formulae makes the follow distribution plot (from Wikipedia image):

So I’ve made a Python module, called “pybenford”, which helps me in the creation and analysis of datasets, like the Stock Historical Prices for Apple Inc.

I think that the code is simple enough to understand and reuse:

import pybenford
import csv

def convert_value(value):
   return float(value.replace(",","."))

stock_file      = open("apple_stock.csv", "r")
csv_apple_stock = csv.reader(stock_file, delimiter=";")
yahoo_format    = csv_apple_stock.next()
stock_prices    = [ convert_value(row[yahoo_format.index("Volume")]) for row in csv_apple_stock ]

benford_law   = pybenford.benford_law()
benford_apple = pybenford.calc_firstdigit(stock_prices)

pybenford.plot_comparative(benford_apple, benford_law, "Apple Stock Volume")

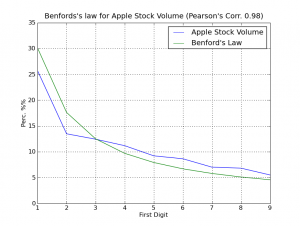
This code will iterate over the Apple Inc. historical data downloaded from Yahoo! Finance and will verify the leading digit for the field “Volume” of the dataset, the dataset is from between 1984 and today (200). Then the pybenford will plot (using Matplotlib) a comparative graph of the dataset with the Benford’s Law distribution. In the graph, there is a Pearson’s Correlation value on the title; the Pearson’s Correlation ranges from +1 to -1. A correlation of +1 means that there is a perfect positive linear relationship between variables.

Follow the plot of comparative (click on the image to enlarge):

stock_volume

As you can surprisely see, we have a strong correlation between the Volume data and the Benford’s Law, the Pearson’s Correlation was 0.98, a higher coefficient, this is like black magic for me =)

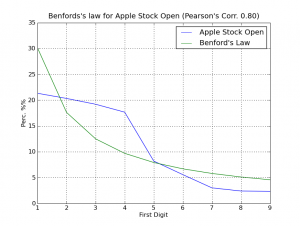
Follow another graph of the opening stock prices:

stock_open

The correlation this time was low, but it continues with a significant Pearson’s coefficient of 0.80.

I hope you enjoyed =)

The source-code for the “pybenford” can be downloaded here. This module is a simple collection of some very very simple functions.

Genetic Algorithms, genetic programming, News, Pyevolve, Python, Time Waste

Genetic Algorithms on cellphones ! Pyevolve on Nokia N73 (Symbian + PyS60)

Hello ! This is the 2nd post related to the Pyevolve on portable devices, the first was in the Sony PSP here and the PoC of Pyevolve solving the TSP problem with a graphical output of best individuals on the Sony PSP screen. Now, it’s time to go further and run Pyevolve into the most portable device used by us, the cellphone.

Using the new version of the PyS60, the release 1.9.1, which comes with the new amazing 2.5.1 Python core, I’ve executed the Pyevolve with no problem, and I was very surprised by the performance of the GA on the Nokia N73, the GA I’ve ran is the minimization of one of the De Jogn’s test suite functions, the Sphere function, the function is very simple and I’ve used 5 real variables between the interval of [-5.12, 5.12], the Gaussian Real Mutator and the Single Point Crossover of the Pyevolve framework. Also I’ve set a population size of 80 individuals and the mutation rate of 2% and crossover rate of 90%.

After 18 generations (about 8 seconds), the GA ended with the best score of 0.0, representing the optimal minimization of the De Jong’s Sphere function.

Follow some screenshots of the adventure (click on the pictures to enlarge):

How to install Pyevolve on the PyS60 ?

1) First, you need to install the PyS60 for your Symbian platform. Here is the installation manual. The order of the installation is: Python Runtime for S60, Python Script Shell and PIPS Library.

2) Then, you must create a directory on your Memory Card, inside the “Python” directory, named “Lib”, and inside this directory, you copy the “pyevolve” folder. The absolute folder structure will be like this:

MemoryCard:\Python\Lib\pyevolve

Some features of the framework will not work, like the some DB Adapters, however, the GA core is working really good. I’ve used the Pyevolve subversion release r157, but it should works with the 0.5 release too. I’ve not finished the documentation of the new release, I’m working on some features yet.

Here is the source code I’ve used to minimize the De Jong’s Sphere function:

import e32
print "Loading Pyevolve modules...",
e32.ao_yield()

from pyevolve import G1DList, GSimpleGA
from pyevolve import Initializators, Mutators, Consts

print " done !"
e32.ao_yield()

def sphere(xlist):
   n = len(xlist)
   total = 0
   for i in range(n):
      total += (xlist[i]**2)
   return total

def ga_callback(ga_engine):
   gen = ga_engine.getCurrentGeneration()
   best = ga.bestIndividual()
   print "Generation %d - Best Score: %.2f" % (gen, best.score)
   e32.ao_yield()

   return False

if __name__ == "__main__":

   genome = G1DList.G1DList(5)
   genome.setParams(rangemin=-5.12, rangemax=5.13, bestRawScore=0.00, roundDecimal=2)
   genome.initializator.set(Initializators.G1DListInitializatorReal)
   genome.mutator.set(Mutators.G1DListMutatorRealGaussian)

   genome.evaluator.set(sphere)

   ga = GSimpleGA.GSimpleGA(genome)
   ga.setMinimax(Consts.minimaxType["minimize"])
   ga.setGenerations(100)
   ga.setMutationRate(0.02)
   ga.terminationCriteria.set(GSimpleGA.RawScoreCriteria)
   ga.stepCallback.set(ga_callback)

   ga.evolve()

   best = ga.bestIndividual()
   print "\nBest individual score: %.2f" % (best.score,)

You can note the use of the module “e32” of the PyS60, this is used to process pending events, so we can follow the statistics of current generation while it evolves.

I hope you enjoyed this work, the next step is to port the TSP problem to cellphone =)

Some time ago I’ve asked Guido van Rossum on the Google Moderator about the future of Python for mobile phones (aka PyS60), and here is the full answer from him:

I’m hopeful, but concerned that Java has cornered this market. For example, the Android development kit is extremely slick but only supports Java at the moment. There’s no doubt about which is the dominant app development language on most mobile platforms, including S60 and anything Symbian-based. In the long run I expect Python to just happen on mobile devices, as increases in disk space will allow the set of pre-installed tools to grow. In the mean time I see a bigger role for Python server-side, for example there are iPhone apps backed by services written in Python running on App Engine (and probably also apps backed by Python running on other server platforms).
Guido van Rossum, San Francisco Bay Area

Well, I think that with this new version of PyS60, with the 2.5.1 core, the Python on mobiles can be very useful and productive. Recently, Nokia have signed a loan agreement with the European Investment Bank (EIB) to the tune of €500 million ($623.9 million). According to Reuters, the five-year loan will be used in part to “finance software research and development (R&D) projects Nokia is undertaking during 2009-2011 to make Symbian-based smartphones more competitive.” So I’m with great expectations with this new investment on Symbian smartphones and with the future possibilities of the PyS60.

I'm starting a new course "Machine Learning: Foundations and Engineering" for 2024.