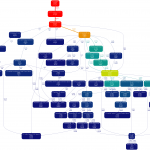
Pyevolve profiling dot graph
I’ve created a profiling dot graph of the pyevolve_example15_rosenbrock.py with the Gprof2Dot, this Pyevolve example is the minimization of the Rosenbrock function with 20 variables.
I’ve created that graph to show the call structure of Pyevolve, as you can see, the accumulation in FunctionSlot applyFunctions method is the effect of the use of FunctionSlot use in many operations like scaling, selection, evaluation, crossover and mutation.


Oi! I wonder, have you ever tried optimizing the time hogs with cython?
I am guessing that *at least* the rosenbrock evaluation would see a significant speedup just because of how simple it is. It uses normal lists and probably can be ported into almost pure C.
But what about the mutator functions? Is there a specific mutator that uses mostly primitive objects, like maybe the binary genome mutator? Maybe even the 1DListGenome would work.
I’ll get back with you later this week if I can figure out the best way of pulling these routines out. It’s surprising how much can be accomplished with cython and a bit of well formed code 🙂
-Blaine
The best approach to speedup pyevolve performance I’ve seen until now is the use of PyPy (with JIT backend), you must check it.
One more thing – mind posting, if you recall, what command params you used to produce this png? I’d like to compare my results.
I can’t remember the exactly parameters right now, I think it was something like ‘dot -Tpng -o out.png’ in a pipe of the output.