Review Board – Review Requests plotting using Python
Review Board is one of these projects that Python community is always proud of, I really think that it became the de facto standard for code reviews nowadays. Review Board comes with an interesting an very useful REST API which you can use to retrieve information about the code reviews, comments, diffs and every single information stored on its database. So, I created a small Python script called rbstats that retrieves information about the Review Requests done by the users and then plots a heat map using matplotlib. I’ll show an example of the use on the Review Board system of the Apache foundation.
To use the tool, just call it with the API URL of the Review Boars system, i.e.:
python rb_stats.py
--max-results 80 https://reviews.apache.org/api
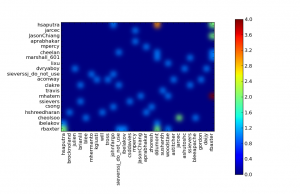
an then you’ll get a graphical plot like this (click to enlarge):
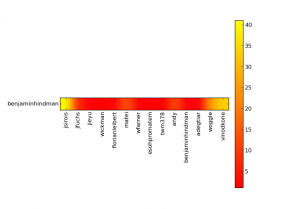
Where the “hottest” points are weighted according to the number of the code reviews that the user have created to the other axis user. You can also plot the statistics by user, for instance of the user benjaminhindman using the autumn colormap and with 400 max results:
python rb_stats.py
--max-results 400
--from-user benjaminhindman
--colormap autumn https://reviews.apache.org/api
Click to enlarge the image:


