Some time ago I’d done a post about acessing the MODIS near-real time satellite images using Python and the data public available at NASA MODIS, if you are interested in those images, take a look in the post here.
I’ve created now a Python package called pyearthquake to automatic retrieve any MODIS subset image from the NASA Rapid Response System in a easy way, just by using the subset, satellite and resolution parameters. The package has a module to get real-time USGS Earthquake data from the USGS website and automatically parse it for you, as well functions to retrieve shakemaps and other products from the USGS.
Retrieving, handling and ploting USGS data
Let’s start talking about the public available catalogs with real-time Earthquake data from the USGS site (they are in CSV formats, there are others in XML and KMZ formats if you’re interested too, but I focused in the CSV format files to create the Python modules:
Note from USGS site: files are not inclusive (the past day file does not include past hour events, for example).
M1+ Earthquakes (past hour) – M1+PAST_HOUR
This is the worldwide catalog with earthquake data from the past hour;
M1+ Earthquakes (past day) – M1+PAST_DAY
This is the worldwide catalog with earthquake data from the past day;
M1+ Earthquakes (past 7 days) – M1+PAST_7DAY
This is the worldwide catalog with earthquake data from the past 7 days;
To get and process data from these catalogs, you can use the pyearthquake package I created, let’s install it first:
easy_install pyearthquake
This command will use the easy_install to automatic install the package from the PyPI respository, it will automatically resolve the requirements too, but if you face some problem, here is the explicit requirements: matplotlib >= 0.99.0, numpy >= 1.3.0, PIL >= 1.1.6 and basemap >= 0.99.4. The basemap package is map toolkit for matplotlib.
Let’s now, for example, get the catalog for the past hour earthquake data, we can do it by using the Python interpreter prompt, like this:
>>> catalog = usgs.retrieve_catalog("M1+PAST_HOUR")
>>> catalog
<pyearthquake.usgs.USGSCatalog instance at 0x00BD0FD0>
All catalogs available are: M1+PAST_HOUR, M1+PAST_DAY and M1+PAST_7DAY. But if you type a wrong catalog name, it will show you the name of all available.
You can now work with the “catalog” object to explore the data retrieved from the USGS site:
>>> list(catalog)
[{'Src': 'ci', 'Region': 'Central California', 'Lon': '-118.2063', 'Datetime': 'Saturday, January 16, 2010 17:12:20 UTC', 'Depth':
 '6.00', 'Version': '1', 'Lat': '36.2061', 'Eqid': '10530221', 'Magnitude': '1.9', 'NST': '27'}, {'Src': 'ak', 'Region': 'Southern
 Alaska', 'Lon': '-150.0829', 'Datetime': 'Saturday, January 16, 2010 16:47:05 UTC', 'Depth': '34.90', 'Version': '1', 'Lat': '61.
4521', 'Eqid': '10029267', 'Magnitude': '2.3', 'NST': '27'}]
>>> for row in catalog:
...    print row["Magnitude"], row["Depth"], row["Datetime"], row["Depth"], row["Region"]
...
1.9 6.00 Saturday, January 16, 2010 17:12:20 UTC 6.00 Central California
2.3 34.90 Saturday, January 16, 2010 16:47:05 UTC 34.90 Southern Alaska
As you can see, the “catalog” is an interable object where you can get all data from the earthquakes, like the Magnitude, Latitude, Longitude, Depth, Date, Region Name, etc…
Let’s now get the past 7 days earthquake data:
>>> catalog = usgs.retrieve_catalog("M1+PAST_7DAY")
>>> len(catalog)
1142
In the past 7 days, there was 1.142 Magnitude 1+ earthquakes on earth, if we want to find the event for the last Haiti tragedy, we can filter the Magnitude of the catalog by 6.0 for example:
>>> magnitude6 = [event for event in catalog if float(event["Magnitude"]) >= 6.0]
>>> len(magnitude6)
3
>>> for row in magnitude6:
...    print row["Eqid"], row["Magnitude"], row["Depth"], row["Datetime"], row["Depth"], row["Region"]
...
2010rla9 6.0 32.40 Thursday, January 14, 2010 14:03:40 UTC 32.40 south of the Mariana Islands
2010rja6 7.0 13.00 Tuesday, January 12, 2010 21:53:10 UTC 13.00 Haiti region
71338066 6.5 29.30 Sunday, January 10, 2010 00:27:39 UTC 29.30 offshore Northern California
As we can see, the Earthquake ID “2010rja6” was the ID used by USGS to identify the 7.0 magnitude Haiti earthquake of the 12 January which has devastated the region and the unfortunate people of Haiti.
USGS also provides a Shakemaps, which are automatic computer generated maps with the potential damage in the region of the earthquake, to get it, let’s use the pyearthquake package:
>>> haiti_eq = magnitude6[1]
>>> usgs.retrieve_shakemap(haiti_eq, "INSTUMENTAL_INTENSITY")
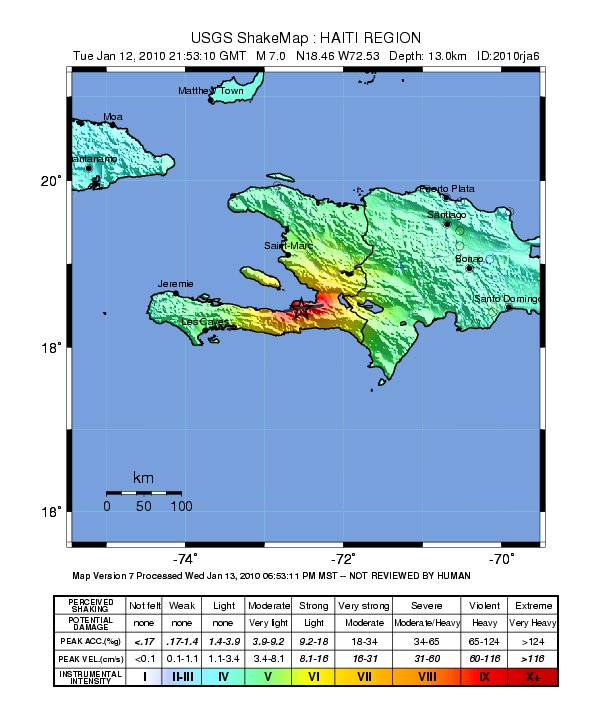 The second argument of the function is the shakemap type, there are other products you can get from USGS too, like the Media Maps, Peak Ground Acceleration. These maps are available in the package as: INSTRUMENTAL_INTENSITY, BARE, DECORATED, UNCERTAINTY and PEAK_GROUND_ACC.
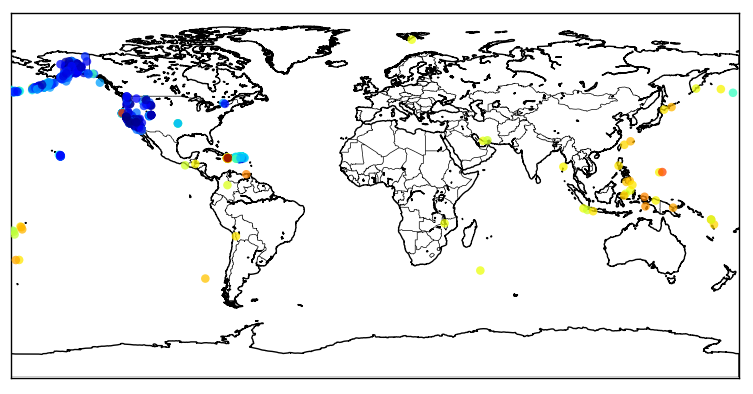
The packas has functions to plot maps of the earthquakes (using Matplotlib), see how to plot a map of the earthquakes from the past 7 days:
>>> usgs.plot_events(catalog)
<mpl_toolkits.basemap.Basemap object at 0x01E6BDB0>
 Now a zoom in the Haiti region:
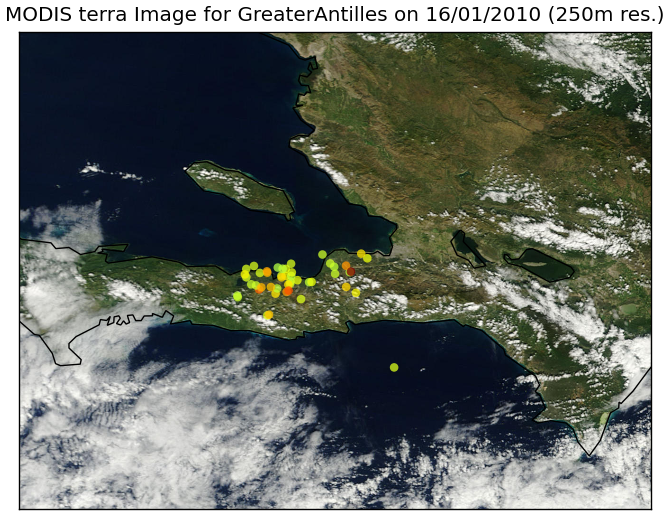
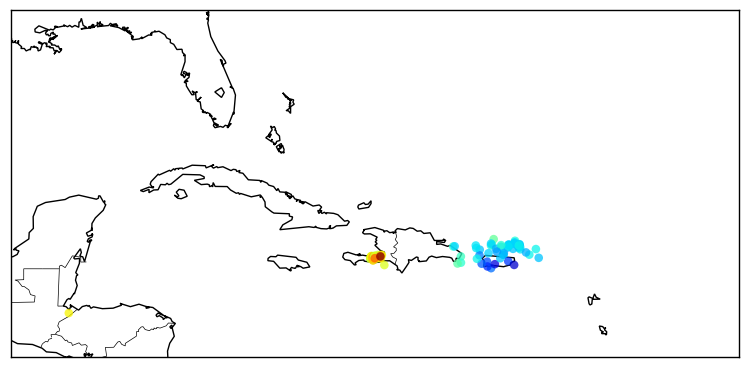 The color of the points are relative to their magnitudes, I’m using here the JET (the yellow/red points are earthquakes with higher magnitudes) color map from Matplotlib, see in this link to use more color maps.
Retrieving last images from MODIS Satellites and ploting earthquakes
Let’s talk now about the “modis” module of the pyearthquake module. This module can be used to get the most recent or archived images (up to 250m resolution) from MODIS Aqua/Terra satellites. First of all, you must know what subset you want to retrieve from MODIS website, the subsets are available here in NASA site. To plot the Haiti region I’ll use the subset named “GreaterAntilles” which covers the Haiti region. To get the satellite images from today date, we can do like this:
>>> from pyearthquake import modis
>>> import datetime
>>> now = datetime.datetime.now()
>>> bmap = modis.get_modis_subset(now,
...                               "GreaterAntilles",
...                               satellite_name="terra",
...                               resolution="250m")
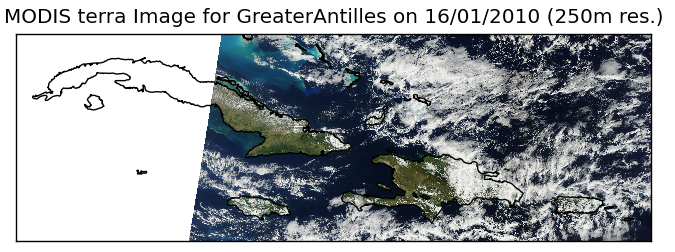
This command will get the composite image of the subset “GreaterAntilles” taken today from the “terra” satellite with a resolution of 250m (in fact, this will take a while, since I’m using a higher resolution here, the maximum is 250m). And here is the result:
And here is after a zoom into the Haiti region near of Port-au-Prince:
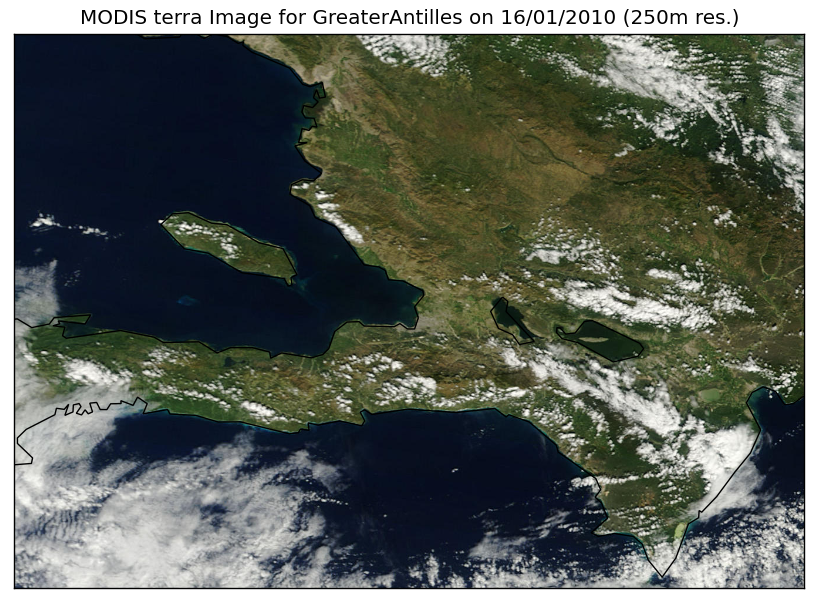
This is the interesting part about MODIS, this photo, is from TODAY.
Now, let’s merge together the information about the earthquakes from the USGS data and the recent images from the Haiti:
import datetime
from pyearthquake import usgs
from pyearthquake import modis

catalog = usgs.retrieve_catalog("M1+PAST_7DAY")

now = datetime.datetime.now()
bmap = modis.get_modis_subset(now,
                              "GreaterAntilles",
                              satellite_name="terra",
                              resolution="250m",
                              show=False)
usgs.plot_events(catalog, bmap)
And here is the result of the past 7 days earthquakes plot over the today MODIS image from satellite Terra:
That’s all =) you can use the package to plot earthquakes over other regions of world too, just select another subset from the MODIS Rapid Response System site.
– Christian S. Perone
All images and data shown here are from MODIS Response System or U.S. Geological Survey.


