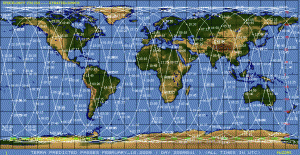
From Modis Rapid Response System site:
The MODIS Rapid Response System was developed to provide daily satellite images of the Earth’s landmasses in near real time. True-color, photo-like imagery and false-color imagery are available within a few hours of being collected, making the system a valuable resource (…).
The Moderate Resolution Imaging Spectroradiometer (MODIS) flies onboard NASA’s Aqua and Terra satellites as part of the NASA-centered international Earth Observing System. Both satellites orbit the Earth from pole to pole, seeing most of the globe every day. Onboard Terra, MODIS sees the Earth during the morning, while Aqua MODIS orbits the Earth in the afternoon.
One thing that a few people know is that everyone can have access to a near real-time moderate resolution images from two NASA satellites (Aqua and Terra) which orbits the earth from pole to pole every day and captures images and data like thermal anomalies from the most part of the globe.
In this post, I’ll show how to get and plot those imagery and data to a map using Python and Matplotlib + Basemap toolkit.

