I started this project past year but never managed to finish due to many cumbersome issues tied to the mechanical part of the front panel which took me a lot of time, so this month I decided to finish it and this past weekend I was finally able to get some time to address the mechanical part. I’m very pleased with the results and there are still some things to finish but since it is starting to look great, I decided to share some photos and videos of the on-going project. This is the initial prototype so there is a unbearable amount of wiring around, however, I’m planning to hide all of this on a small case later and also design a PCB board for integrating all of this, which will help a lot with the wiring and clutter.
The main idea of this box is to provide a more tactile experience to monitoring distributed training GPUs, so I tried to make something that can fit on top of the desktop and had a more analog visualization with LED Bars and physical knobs that you can use. I iterated a lot on the design and I found this one to be quite elegant and also easy to operate.
Pandora M1
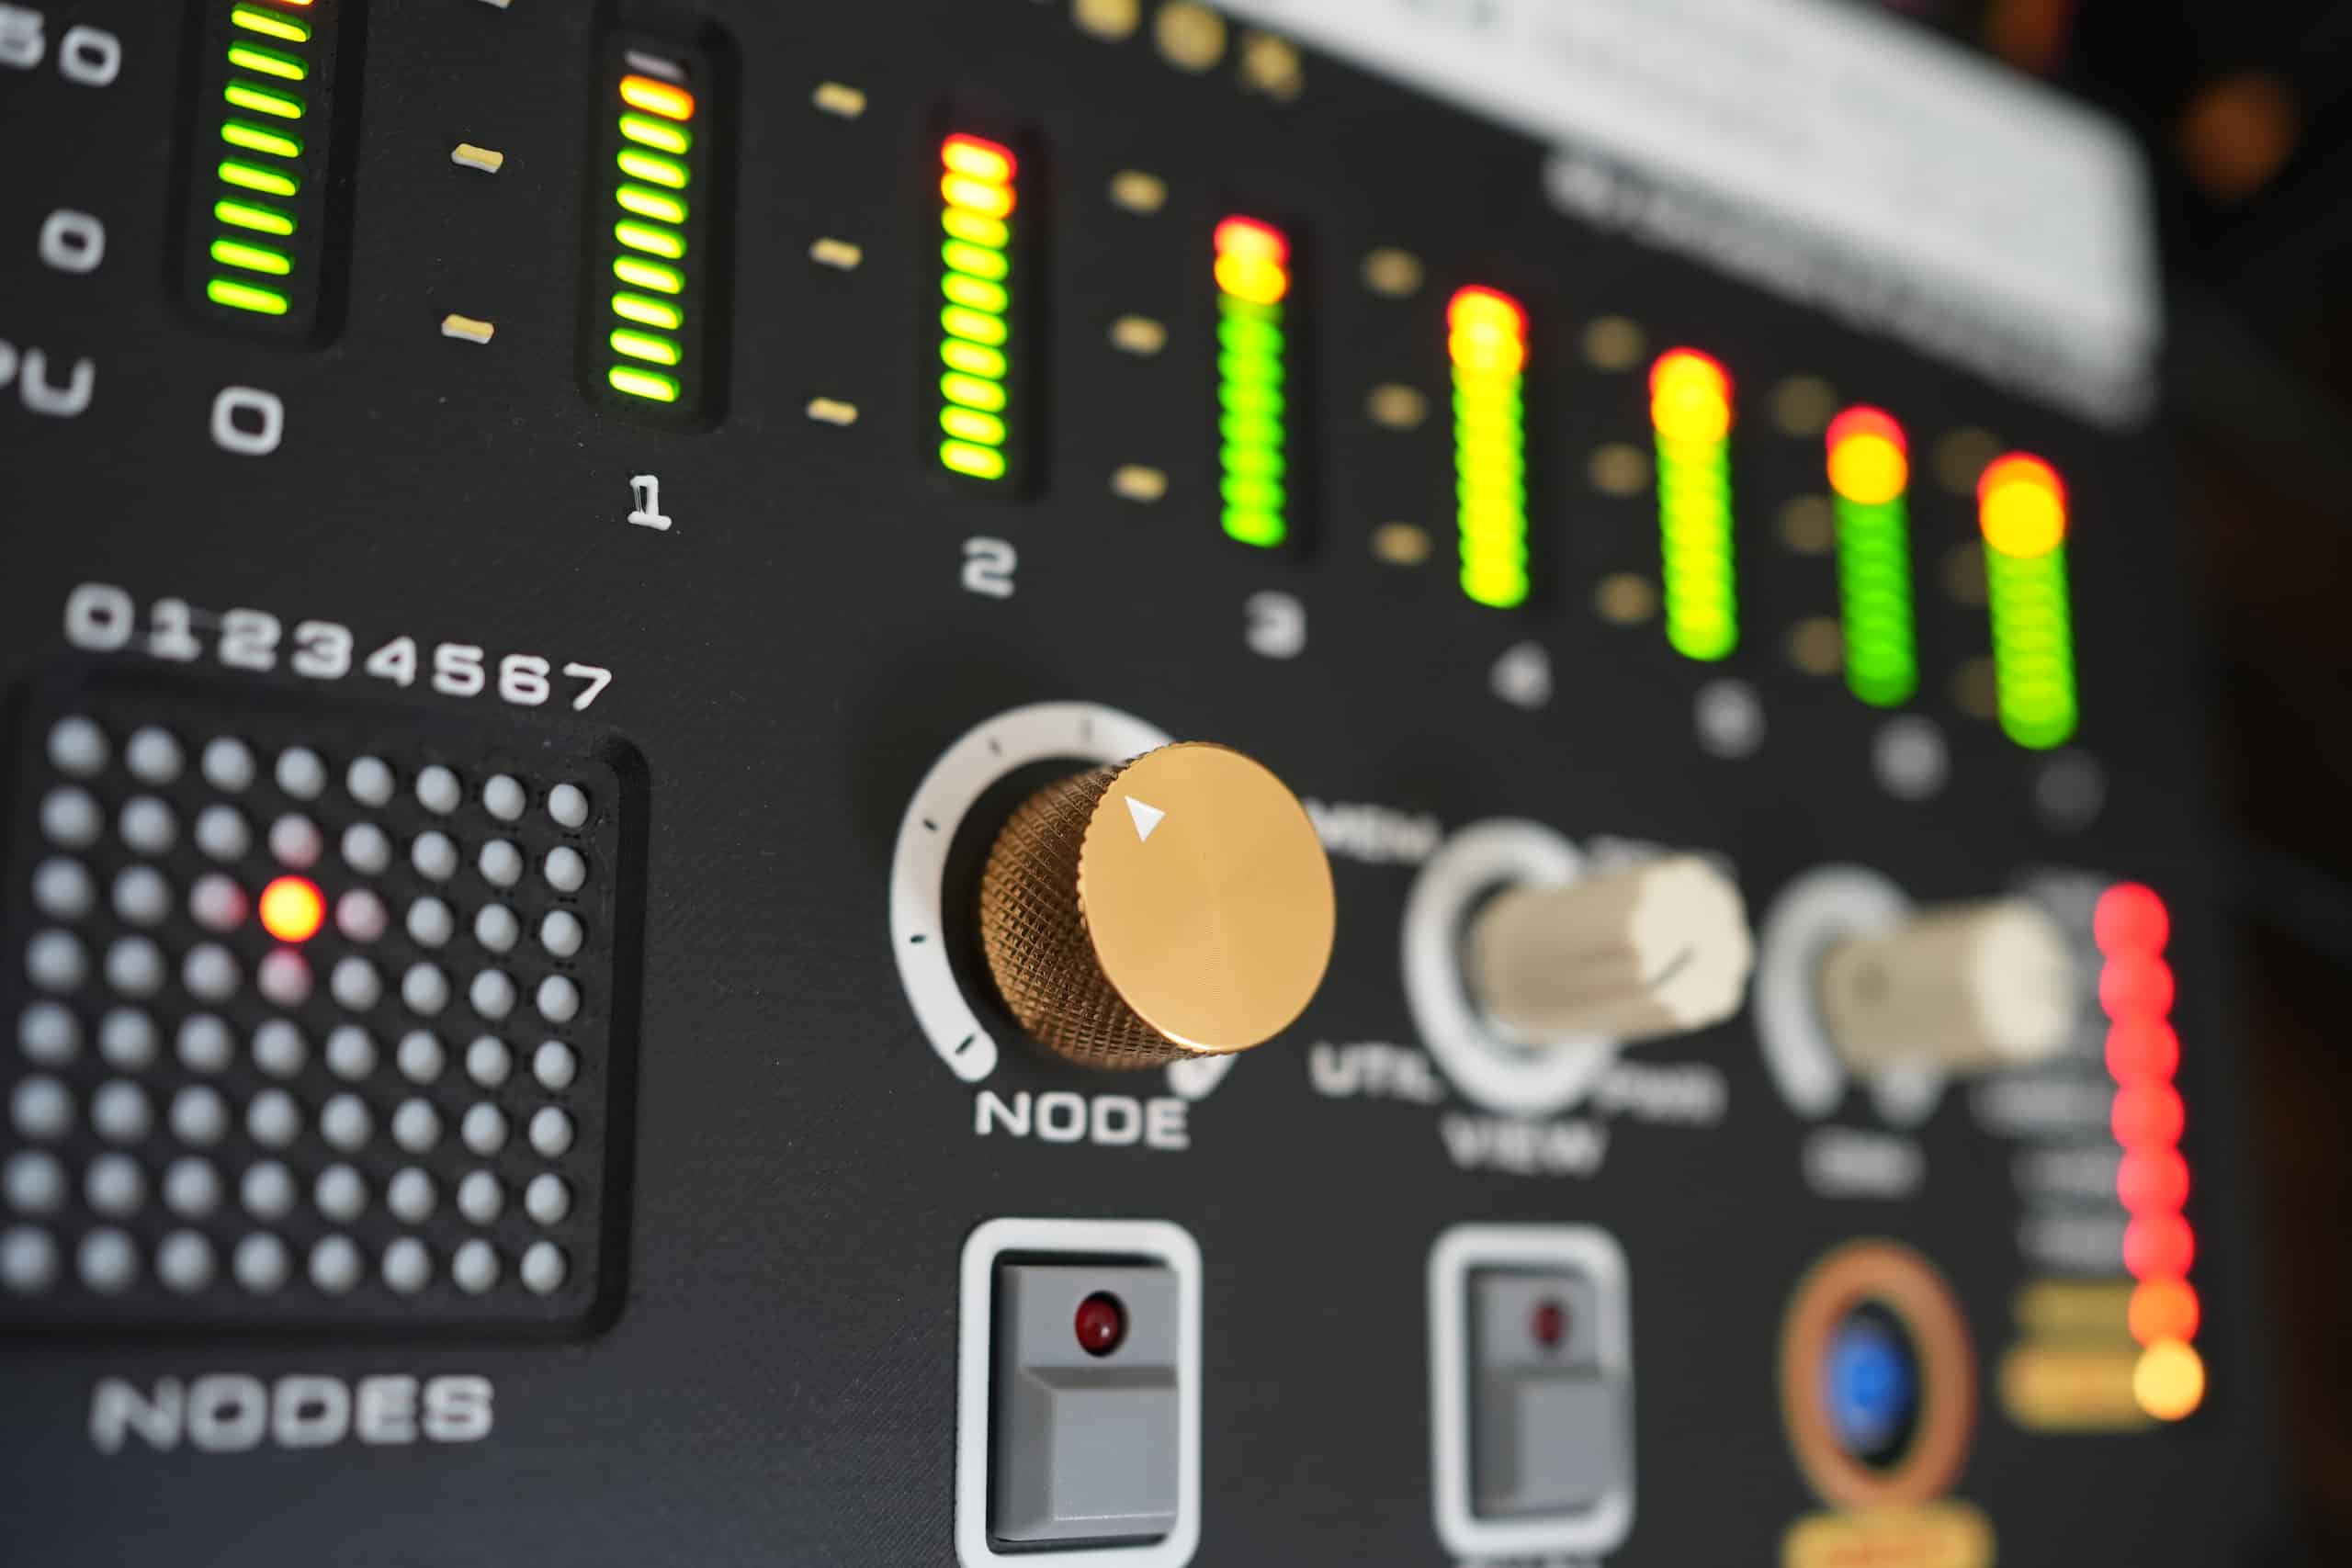
The main information that I wanted to put on the front panel was GPU Utilisation, GPU memory, GPU Temperature and also Power Usage. The tricky problem is that you want to visualize that for multiple nodes as well, so what I did was to use a LED Matrix to show each node so that when there is an issue on a node, it will blink that as well so you can go to that node and look at the stats as well. To select the node I added one big metal head on a potentiometer so that it is easier to move around on the nodes, it goes from 0 to 63, so it supports 64 nodes max, and given that each (at maximum 8) GPU has an individual LED Bar for it, the panel supports visualisation of 512 GPUs in total.
